


 texto em
  Inglês (pdf)
 Artigo em XML
 Referências do artigo
 Enviar este artigo por email
 Citado por SciELO
  Similares em
SciELO
Similares em
SciELO 
 Permalink
1 INTRODUCTION
It is widely recognized that tourism market dynamics no longer pivots on products or services, but experiences, so that tourists become loyal customers and prescribers (Fuste and Nava, 2015), therefore the reported experience is a fundamental factor in tourism planning and assessment (Hernández, Vargas & Aguilar, 2015). In this sense, offering quality experiences is of utmost importance for the competitiveness of tourism industry (Sernatur, 2016).
Relevance of knowledge about tourist experience has been reflected in applied research. According to Tussyadiah (2014) the recent scientific production tends to consider tourist experience as the essence of tourism. In the same line of thinking, Bosangit, Hibbert, and McCabe (2015), point out that the analysis of experience has become one of the most significant areas of study in tourism research; and in fact, the related academic literature has been enriched by new voices from regions other than the traditional Anglophone North Atlantic (Ryan, 2010). However, recalling what Oakeshot referred to in 1933, experience is the most difficult word to handle of all in the philosophical vocabulary and the same can be taken to the field of experience in tourism. Currently, despite the wealth of work on the topic, the empirical e-
vidence remains weak. As knowledge about the dimensions, determinants, and consequences of the tourism experience advances, it is also necessary to improve research methods and approaches (Ingram, Caruana & McCabe; 2017).
In this sense, the present research aims to measure the tourist experience through a quantitative approach, using the survey technique and the importance-performance analysis matrix. The place of study is Quito, an emblematic destination of Ecuador for having won for four consecutive years the recognition of the "Word Travel Award" in the "Leading Destination" category in South America. The study is of special interest because it is a pioneering approach to tourist experience in the city from a holistic perspective and it is particularly useful as a support for decision-making regarding the structuring of supply and destination management. This article is partially based on a thesis work recently conducted and directed by the authors, which has been complemented with a multivariate analysis and the importance- performance analysis matrix.
1.1 Tourist experience in destination
As Hossany and Gilbert (2014) point out, tourist destinations are better prepared for success if they recognize the quality of the experience in their offers. The awareness of this fact has promoted a boom in research in this field. The experience of the consumer has been subject of profuse studies since its knowledge provides substantial support to the decision making in the field of marketing; nevertheless, even its conceptualization and measurement are still ambiguous.
In the field of tourism and on a territorial analysis scale, the tourist experience can be expressed in a very simple way as in the definition of Sharpley and Stone (2011) where it constitutes what the tourist experiences. In a more developed ways it is defined as quoted below:
A tourist experience is a past personal travel-related event, strong enough to have entered long-term memory (Larsen, 2007)
The experience of the tourist consists of a continuous flux of related and integrated services which are acquired during a limited period of time, often in different geographical areas (Mendes et al., 2010).
The tourist experience is a set of physical, emotional, sensory, spiritual, and/or intellectual impressions, subjectively perceived by the tourists, from the moment they plan their trip, enjoy it in the chosen destination and even when they return to their place of origin, remembering their trip (Otto & Ritchie, 1995 cited by Rivera, 2013).
It is a personal experience, reflecting tangible and intangible aspects that impact and suffer the impact of unique and memorable events (Rivera, 2013).
The tourist experience is a cumulative process that includes three phases: before traveling, during the vacations at the destination and after traveling; and that needs an explicit preparation to happen (Carballo, et al., 2015).
Destination experience is the multidimensional takeaway impression, for-med by different components that are difficult to determine (Karayilan & Cetin, 2016).
According to this, it can be affirmed that the tourist experience in destination takes shape in the mind of the tourist through a process of fixation and aggregation of sensory, cognitive, and emotional impressions in a period of trip that goes from planning to recollection. Following Pine and Gilmore (1998) the experiences can be grouped into four categories: entertainment, educational, esthetic, and escapist; while for Aho (2001), informative, emotional, practical, and transformative experiences are distinguished.
The traveler experience in destination as a multidimensional construct, has gained the attention of numerous experts who have gradually added variables to be considered as part of it. Thus, to the early proposal of Otto and Ritchie (1996) that raise the variables: hedonism, involvement, peace of mind, and recognition; others have been added such as: love, joy, positive surprise (Hosany & Gilbert, 2010); involvement, timelessness, happiness, pleasure, relaxation, stimulation, spontaneity, meaningfulness, sense of separation, adventure, personal relevance, novelty, local culture, escaping pressure and intellectual cultivation (Kim, Ritchie & McCormick, 2010); freedom of choice, fantasy, spontaneity, special entertainment, sense of self-realization (Nash & Smith, 1991, cited by Rivera M., 2012); adverse feelings (Kim, 2014); authentic characteristics of the destination and cultural heritage (Cetin & Bilgihan, 2015), among others. However, in this same line, the approach of Pulido and Navarro (2014) proposes an integrated set of factors and indicators to measure the tourist's experience in the destination, which include social, emotional, sensory, creative, relational, cognitive, and personal factors. The nine factors that measure the tourist experience from the point of view of these authors, can be seen in Table 1.
Table 1 Tourist experience factors and indicators
| Factors | Indicators |
| Uniqueness | Unique resources History and singularity of the place Particular climate Unique tourism product Unique environmental quality Characteristic food of the place Unique idiosyncrasy of the people of the area |
| Motivation | Prestige Pride Status Appearances Honor Respect Reputation Risk/danger/fear Self-realization |
| Co-creation | Participation in the provision / creation / diffusion / consumption of services or products Possibility to adapt the product to my preferences in real time |
| Multisensory | Satisfaction Wellbeing Positive/negative feelings experienced (content, delighted, impressed, surprised) Positive/negative evaluation of the senses (sight, hearing, taste, touch, smell) |
| Entertainment | Fun and sport activities Outdoors and nature Enjoyment Party atmosphere Shows and concerts Arts and culture |
| Personal development | Learning and education Cultural interest Expand horizons Affective needs covered Self-realization needs covered Cultural enrichment Emotional intelligence |
| Relational development | Social interaction |
| Rational quality | Affordable prices Travel comfort Easy to find locations Practical public transportation Attributes of service Professionalism and skills that are demonstrated in customer service |
| Responsabiity | Integrity Discipline Reciprocity |
Source: (Pulido Fernández & Navarro Hermoso, 2014); The authors
1.2 Tourist experience measurement in destinations
According to Burns and Holden (1995), measurement of integral experience in destinations is more complex than at the level of individual services. Carballo et al., (2015) note that because most experiences in tourism take place in a short period with uninterrupted episodes, it can be difficult to have a true understanding of them. They list some efforts that have been developed to study the tourist experience as: the open-ended journal, mail surveys, and in-depth interviews (Nickerson, 2004); recording tape method on own initiative and in-depth interviews (Lee et al., 1994); the incident technique (Jackson et al., 1996); the analysis of critical moments of truth (Carlzon, 1987); the experience map (Schmitt, 2003); the development of a dramatic script (Harris et al., 2003); among others of a qualitative nature. However, they emphasize the need for new forms of applied research. This is especially necessary in a quantitative approach, where it is observed an important limitation to understand in depth its nature and assessment.
In the last five years, there have been important contributions to the tourism experience research: Prayag, Hosany and Odeh (2013) studied the relationship between emotional experiences, satisfaction, and behavioral intentions in Petra, Jordan based on a survey; Bosangit, Hibbert and McCabe (2015) studied the tourist experience based on content analysis of travelers' blogs in the United Kingdom. Park and Almeida (2016) conducted 28 semi-structured interviews with Korean tourists to determine central elements of memorable tourist experience on three temporary travel stations (pre- during and post-trip). Ingram, Caruana and McCabe (2017) applied the participant consultation in a selection of 16 tourists whose destination varied between domestic, European, and international; also, in its full travel process. Finally, Wearing and Foley (2017) studied the movement of tourists through the city to understand their experiences from a perspective that claims the low visibility given to the female gender in tourism research.
2 METHODOLOGY
This empirical study was developed by applying a survey to a sample of foreign tourists over 18 years of age, who visited Quito throughout March 2017. A sample of 384 people was calculated, considering a margin of error of +/- 5% and a confidence level of 95%, however, 402 valid questionnaires were obtained.
Survey questionnaires were applied after visiting Quito to obtain responses based on an overall perception of the tourist experience in the city. Therefore, tourists were interviewed during their stay in the city to retrieve their email address and tentative date of departure from Ecuador. A message was sent to them inviting to participate in the survey, which was entered online in the Google platform
The questionnaire was structured in two sections; the first contained nine multiple-choice and one open-ended questions, aimed to obtain socio-demographic information; the second contained 54 five-point Likert scale questions (from very low to very high), to measure the importance of dimensions and the assessment of experience indicators, based on the proposal of tourism experience factors and indicators from Pulido and Navarro (2014).
A pilot study was conducted in February 2017, with 55 questionnaires in order to validate the understanding of the survey instrument and verify its reliability. Cronbach's Alpha reliability was + .86. It is considered acceptable, since Nunnally and Bernstein (1994) consider acceptable a scale if it has a Cronbach’s alpha greater than 0.7.
Data analysis was performed using SPSS 3.0 and missing values were eliminated through tabulation. Several statistical tests were applied with diverse aims. First, a Confirmatory Factor Analysis (CFA) to validate dimensions and indicators proposed by Pulido and Navarro (2014); a one-way ANOVA with Tukey post hoc test, to assess the significance of differences between pairs of factors; the Pearson and Spearman correlation coefficients to establish dependence between variables. Finally, an importance-performance analysis matrix was prepared to compare what tourists expected to what they obtained regarding the experience in Quito from their perspective.
3 RESULTS
3.1 Profile of respondent tourist
The profile of foreign tourists shows diversity of nationalities, the most frequent of which are the following: American (25.1%), German (12.7%), Argentine (8.5%), Colombian (8%), British (7.5%) and Canadian (6%). Among profile features that also stand out for higher frequency are: age (about 34,3% of tourist are between 26 and 35 years old), educational level (about 74,1% of them have a university degree), marital status (about 60.9% of them are single), occupation (about 64.7% are in the professional field), travel organization (about 78.1% of tourists have planned their own trips), average daily cost (between USD 16 and 50) and average stay (between 1 and 3 days mostly). A detailed profile is shown in Table 2.
Table 2 Socio demographic profile of respondent tourists
| Variable | % | Variable | % | ||
| Gender | Male | 48.5 | Nationality | United States of America | 25.1 |
| Female | 51.5 | United Kingdom | 7.5 | ||
| Age | Under 25 years old | 27.4 | Germany | 12.7 | |
| 26 - 35 years old | 34.3 | Argentina | 8.5 | ||
| 36 - 45 years old | 12.2 | Venezuela | 4.5 | ||
| 46 - 65 years old | 24.6 | Colombia | 8.0 | ||
| 66 years old or more | 1.5 | Switzerland | 1.5 | ||
| Educational level | High school | 4.5 | South Africa | 0.7 | |
| Under graduation | 74.1 | Canada | 6.0 | ||
| Graduation | 21.4 | China | 2.5 | ||
| Marital status | Single | 60.9 | Mexico | 1.7 | |
| Married | 32.6 | Australia | 2.7 | ||
| Free union | 1.7 | Chile | 3.0 | ||
| Divorced | 1.5 | Guatemala | 1.0 | ||
| Widowed | 3.2 | Peru | 1.2 | ||
| Mode of travel | Organized tour with travel agencies | 21.9 | Brazil | 0.7 | |
| On your own | 78.1 | Cuba | 0.2 | ||
| Daily expenditure | Up to USD 25 | 10.7 | Jamaica | 0.5 | |
| USD 26 - USD 50 | 34.6 | Uruguay | 2.2 | ||
| USD 51 -USD 75 | 28.4 | Denmark | 1.0 | ||
| USD 76 - USD 100 | 17.9 | Spain | 1.0 | ||
| More than USD 100 | 8.5 | Holland | 3.5 | ||
| Occupation | Student | 25.1 | France | 1.0 | |
| Professional | 64.7 | Belgium | 0.7 | ||
| Retired | 8.7 | Philippines | 0.5 | ||
| House work | 0.5 | El Salvador | 0.5 | ||
| Unemployed | 1.0 | Costa Rica | 1.2 | ||
| Length of stay | 1 - 3 days | 41.5 | Bolivia | 0.2 | |
| 4 - 7 days | 28.9 | Total | 100.0 | ||
| 8 - 11 days | 6.0 | ||||
| 12 days or more | 23.6 | ||||
| Travel group | Family | 16.7 | |||
| Friends | 42.3 | ||||
| Work group | 6.0 | ||||
| Couple | 16.4 | ||||
| Alone | 18.7 | ||||
3.2 Confirmation of tourist experience factors
In this stage of the research, 9 factors that define the dimensions of tourist experience, adopted from Pulido and Navarro (2014), were confirmed through Confirmatory Factor Analysis. The Varimax rotation with Kaiser normalization was applied to the correlation matrix. Results show that at least 84.4% of the proposed indicators are agglomerated in the proposed factors, confirming empirically their relevance in the context of Quito to the foreign tourist segment. Thus, of all the items raised by the authors mentioned, only 7 are not matched in the proposed dimensions. The calculated values are presented in Table 3.
Table 3 Confirmatory Factor Analysis: Components
| Indicator | Component | ||||||||
| 1 | 2 | 3 | 4 | 5 | 6 | 7 | 8 | 9 | |
| Motivation - Respect | .785 | ||||||||
| Motivation - Honor | .783 | ||||||||
| Motivation - Reputation | .783 | ||||||||
| Motivation - Prestige | .745 | ||||||||
| Motivation - Pride | .727 | ||||||||
| Motivation - Self-realization | .434 | ||||||||
| Rational Quality - Easy to find locations | .705 | ||||||||
| Rational Quality - Professionalism and skills that are demonstrated in customer service | .704 | ||||||||
| Rational Quality - Travel comfort | .684 | ||||||||
| Entertainment - Outdoors and nature* | .579 | ||||||||
| Rational Quality - Attributes of services | .566 | ||||||||
| Rational Quality - Affordable prices | .421 | ||||||||
| Uniqueness - Unique environmental quality | .691 | ||||||||
| Uniqueness - Particular climate | .646 | ||||||||
| Uniqueness - Unique tourism product | .598 | ||||||||
| Uniqueness - Unique idiosyncrasy of the people of the area | .594 | ||||||||
| Uniqueness - Unique resources | .593 | ||||||||
| Uniqueness - Characteristic food of the place | .512 | ||||||||
| Uniqueness - History and singularity of the place | .483 | ||||||||
| Multisensory - Satisfaction | .761 | ||||||||
| Multisensory - Wellbeing | .710 | ||||||||
| Multisensory - Positive feelings | .701 | ||||||||
| Multisensory - Positive evaluation of senses | .670 | ||||||||
| Entertainment - Arts and culture* | .331 | ||||||||
| Personal development - Cultural interest | .717 | ||||||||
| Personal development - Expand horizons | .659 | ||||||||
| Personal development - Learning and education | .649 | ||||||||
| Personal development - Cultural enrichment | .611 | ||||||||
| Personal development - Self-realization needs covered | .609 | ||||||||
| Personal development - Affective needs covered | .601 | ||||||||
| Entertainment - Party atmosphere | .758 | ||||||||
| Entertainment - Shows and concerts | .629 | ||||||||
| Entertainment -Recreational and sport activities | .578 | ||||||||
| Entertainment - Fun and enjoyment | .529 | ||||||||
| Rational Quality - Practical public transportation* | .522 | ||||||||
| Relational development- Social Interaction* | .473 | ||||||||
| Responsibility - Integrity | .822 | ||||||||
| Responsibility - Discipline | .797 | ||||||||
| Responsibility - Reciprocity | .726 | ||||||||
| Motivation - Appearances* | .638 | ||||||||
| Motivation - Risk, danger, fear* | .619 | ||||||||
| Motivation - Status* | .618 | ||||||||
| Personal development - Emotional Intelligence | .591 | ||||||||
| Co-creation - Participation in the provision / creation / diffusion / consumption of services or products in Quito | .751 | ||||||||
| Co-creation - Possibility to adapt the product to my preferences in real time | .728 | ||||||||
| * Indicator not matched to a proposed dimension | |||||||||
3.3 Valuation of factor importance
Importance given by surveyed tourists to factors/dimensions shows different values as can be seen in Table 4, where the mean, mode, and median values are presented. As can be seen, dimension valued with the highest score was multisensory while the lowest score valued was co-creation.
Table 4 Valuation of factor importance: mean, median, and mode values
| Uniqueness | Motivation | Co-creation | Multisensory | Entertainment | Personal development | Relational development | Rational quality | Responsibility | ||
| N | Valid | 402 | 402 | 402 | 402 | 402 | 402 | 402 | 402 | 402 |
| Invalid | 0 | 0 | 0 | 0 | 0 | 0 | 0 | 0 | 0 | |
| Mean | 3.74 | 3.43 | 2.77 | 3.94 | 3.41 | 3.56 | 3.52 | 3.55 | 3.54 | |
| Mode | 4.00 | 4.00 | 3.00 | 4.00 | 4.00 | 4.00 | 4.00 | 4.00 | 3.00 | |
| Median | 4.00 | 4.00 | 3.00 | 4.00 | 4.00 | 4.00 | 4.00 | 4.00 | 3.00 | |
One-way ANOVA test analysis results confirms there are significant statistical differences among importance values. Taking the analysis deeper, the Tukey’s test demonstrates a wide variability in the assessment of importance given to dimensions, noting that there is no statistical difference in just 8 combinations of 64 possible, which are shown in Table 5
Table 5 Tukey’s multiple comparisons test
| (I)Group | (J)Group | Sig. |
| Uniqueness | Motivation | 1.00 |
| Personal development | 1.00 | |
| Motivation | Personal development | 1.00 |
| Multisensory | Entertainment | 0.06 |
| Rational development | 0.99 | |
| Entertainment | Relational development | 1.00 |
| Rational quality | 0.35 | |
| Relational development | Rational quality | 0.19 |
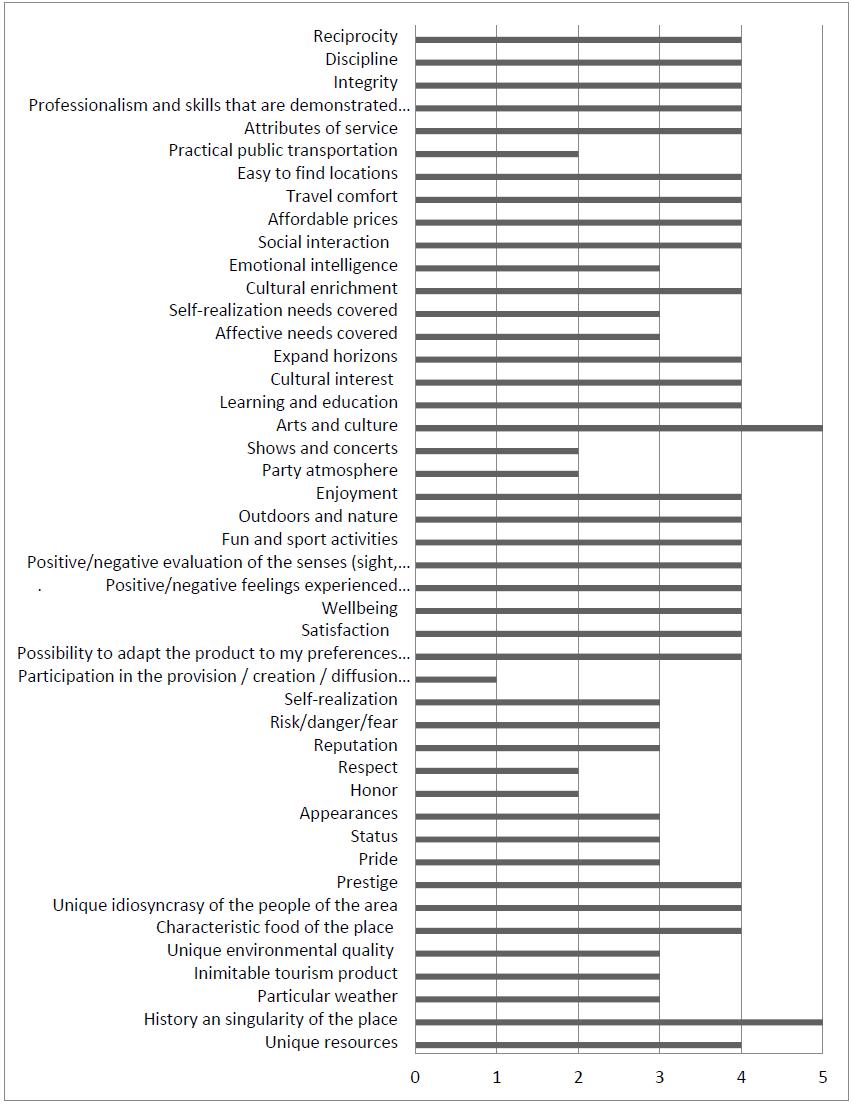
Indicators that make up each factor/dimension obtained diverse scores, noting than more than a half of them obtained a median and statistical mode value equal to 4, what represents a high value. Indicators better valued were: singular history of the place, arts and culture, for which the assessment was very high. On the contrary, worst valued indicators were participation of the tourist in the service/product (very low); and party atmosphere, public transportation, concerts, and shows (low). A broader detail is shown in Figure 1, below.
3.4 Independence analysis of variables
The Chi-Square Test of Independence confirms that gender shows a relationship with: length of stay, travel group, and daily expenditure. In this sense, it is found that the most mentioned length of stay by women was the longest (12 days or more) while the most selected by men is the shortest (1-3 days). In addition, while men and women coincide in selecting more frequently the category of friends as a travel group, the second preference, mostly selected by men, is "alone" and by women, "family". In terms of daily spending, men spend more than women with a daily average between USD 51 and 75 while women spending is between USD 26 and 50.
Age variable is related to: stay, travel group, and daily expenses. Thus, younger people (under 25 years of age) most often choose the longest stay, while older people prefer the shortest stay (1 to 3 days). Likewise, the preferred travel group for people under 35 years of age is "friends", and "couple" for those from 36 years old or more. Regarding daily spending, it can be noted that as age increases the preference for organized tour also increases.
Educational level variable is related to stay and daily expenditure. In this way it is found that people with high school studies stay more days, while people with a higher educational level stay less time (mostly between 1 and 3 days). Also, it is found that the higher levels of education, the greater the expense.
Marital status and stay are dependents variables. In this sense, it is observed that widows stay longer (12 or more days) than single women, and the latter stay longer (3-7 days) than married women.
Also, occupation and daily expenditure are related variables too. It is found that the most frequent spending range for students is from USD 26-50, and for profession als it amounts to USD 51-75, reaching the range of USD 76-100 for retirees.
Nationality is related to several variables: stay, travel group, daily expenditure, and travel mode. Regarding the stay, there are segments of tourist for which affinity for short stays predominates: Canadian, British, Australian, and Swiss; while for other segments such as Americans, Germans, Colombians, Chinese, and Venezuelans long stays are preferred. As for travel group, it is noted that Americans, Germans, and Argentines prefer friends as travel company, while for Venezuelans and Colombians the preference is to travel "as a family"; and finally, tourists from Canada and Australia show a greater preference for traveling as a couple. Regarding the daily spending, people from USA, China, Venezuela, and Colombia appear more frequently in the range between USD 26 and 50, Argentines less than USD 25, unlike German citizens, Australians, Peruvians, and Uruguayans who indicated spending more frequently between USD 51 and 75; finally, the British nationals indicated spending between USD 76 and 100. As for the travel modality, it is noted that Belgian, Canadian, British, and Australian nationals, show greater frequencies of selection in the "organized tour" travel modality. Finally, dependence was confirmed between stay and daily expenditurevariables, noting that the longer the stay the lower the daily expense. Table 6 shows this relationship between variables and the value of significance resulting from Chi-square test.
Table 6 Chi square independence test
| Variable | Variable | Sig. |
| Gender | Stay | .000 |
| Travel group | ||
| Daily expenditure | .008 | |
| Age | Stay | .000 |
| Travel group | ||
| Daily expenditure | ||
| Educational level | Stay | |
| Daily expenditure | ||
| Marital status | Stay | |
| Occupation | Daily expenditure | |
| Nationality | Stay | |
| Travel group |
Results from Spearman correlation coefficient confirms there is a set of variables that show greater influence on valuation of importance of the dimensions under study. These are: gender, age, educational level, marital status, occupation, stay, daily expenditure, and mode of travel.
In this set, the following variables stood out: "age" and "educational level" because they influence the greatest number of dimensions (seven factors/dimensions); followed by "marital status", "daily expenditure", and "travel mode" (five dimensions); and "occupation", and "stay" (four dimensions). Finally, the variable "gender" influences a single dimension. It should be noted that for the dimension "special and unique attributes of the destination" the cited variables do not show dependence.
Expanding the analysis, it is found that the variables that most influence dimension "opportunities for social relations" are: gender, age, educational level, marital status, daily expenditure, and mode of travel. In contrast, for the dimension "value experiences to be counted" the most influential variables are age and length of stay.
In the case of dimension "partake in design, execution and/or diffusion of tourism services and activities", a single influential variable is revealed, i.e. educational level. Instead, for dimension "sensations and emotions during the trip" the influential variables are numerous: age, educational level, marital status, occupation, stay, daily expenditure, and mode of travel.
Dimension "activities and opportunities for entertainment" is mostly influenced by age, educational level, marital status, occupation, and daily expenditure; while dimension "opportunities for personal growth" is strongly influenced by age, educational level, marital status, daily expenditure, and mode of travel. Dimension "opportunities for social relations", is influenced by all the variables. Dimension "quality of services" is influenced by all variables except gender. Finally, dimension "practice of personal values" is influenced by age, educational level, and mode of travel. The detail of this analysis and the calculated values are shown in Table 7
On the other hand, the same analysis applied to indicators of tourism experience in Quito confirms the influence of the variables: nationality, educational level, marital status, stay, travel group, and daily expenditure. In detail, daily expenditure is influential in 80% of the indicators, while educational level is in 60%, stay in 56%, marital status in 51%, nationality in 47%, and travel group in 9% of all indicators.
Table 7 Spearman coefficients of correlation between selected variables and dimensions
| Variable | Personal motivation | Co-creation | Multisensory | Entertainment | Personal development | Relational development | Rational quality | Responsibility | |
| Gender | CC | -.109* | |||||||
| Sig. | .028 | ||||||||
| Age | CC | -.103* | -.290** | -.311** | .165** | -.338** | .273** | .100* | |
| Sig. | .039 | .000 | .000 | .001 | .000 | .000 | .045 | ||
| Educational Level | CC | .129** | -.240** | -.143** | .119* | -.230** | .179** | .104* | |
| Sig. | .010 | .000 | .004 | .017 | .000 | .000 | .037 | ||
| Marital status | CC | -.295** | -.289** | .104* | -.372** | .193** | |||
| Sig. | .000 | .000 | .037 | .000 | .000 | ||||
| Occupation | CC | -.211** | -.281** | -.294** | .147** | ||||
| Sig. | .000 | .000 | .000 | .003 | |||||
| Stay | CC | .098 | .171** | .219** | -.098* | ||||
| Sig. | .050 | .001 | .000 | .050 | |||||
| Daily expenditure | CC | -.235** | -.202** | .124* | -.315** | .264** | |||
| Sig. | .000 | .000 | .013 | .000 | .000 | ||||
| Mode of travel | CC | -.109* | .191** | -.099* | .167** | .120* | |||
| Sig. | .029 | .000 | .046 | .001 | .016 | ||||
| N | 402 | 402 | 402 | 402 | 402 | 402 | 402 | 402 | |
CC= Correlation coefficient; Sig = Sig. (2 label);**. Correlation is significant at the 0.01 level
*. Correlation is significant at the 0.05 level
Study shows that travel group constitution influences "partake of tourists in provision, creation, diffusion and/or consumption of tourist services and products", as well as "entertainment based on nature and outdoors"; and "affective needs covered". The calculated values of the Spearman coefficient can be seen in Table 8.
Table 8 Spearman coefficients of correlation between travel group variable and indicators corresponding to co-creation, entertainment, and personal development factors
| Variable | Co-creation [Participation in the provision/creation /diffusion/consumption of services or products in Quito] | Entertainment [Outdoors and nature] | Personal development [Affective needs covered] | |
| Travel group | CC | .099* | -.111* | .116* |
| Sig. | .047 | .026 | .020 | |
CC= Correlation coefficient; Sig = Sig. (2 label);**. Correlation is significant at the 0.01 level
*. Correlation is significant at the 0.05 level
Similarly, it is found that daily expenditure is influential on the assessment given by tourists to co-creation; entertainment (obtained based on nature and outdoors, party atmosphere, shows and concerts, and art and culture); personal development (based on learning and education, needs for self-fulfillment, and emotional intelligence); social interaction; rational quality (appreciated in terms of affordable prices, comfort, ease of finding places, public transportation, service attributes, and professionalism in customer service); as well as in the practice of values such as discipline, integrity and reciprocity. Values of Spearman coefficient are shown in Tables 9 through 13 below.
Table 9 Spearman coefficient of correlation between diary expenditure variable and indicators corresponding to co-creation factor
| Variable | Co-creation | ||
| Participation in the provision/creation/diffusion/ consumption of services or products in Quito | Possibility to adapt the product to my preferences in real time | ||
| Daily expenditure | CC | .119* | .150** |
| Sig. | .017 | .003 | |
CC= Correlation coefficient; Sig = Sig. (2 label);**. Correlation is significant at the 0.01 level
*. Correlation is significant at the 0.05 level
Table 10 Spearman coefficient of correlation between diary expenditure variable and indicators corresponding to entertainment factor
| Variable | Entertainment | ||||
| Outdoors and nature | Party atmosphere | Shows and concerts | Arts and culture | ||
| Daily expenditure | CC | .172** | -.409** | -.207** | .194** |
| Sig. | .001 | .000 | .000 | .000 | |
CC= Correlation coefficient; Sig = Sig. (2 label);**. Correlation is significant at the 0.01 level *. Correlation is significant at the 0.05 level
Table 11 Spearman coefficient of correlation between daily expenditure variable and indicators corresponding to personal development factor
| Variable | Personal development | |||
| Learning and education | Self-realization needs covered | Emotional intelligence | ||
| Daily expenditure | CC | .151** | -.119* | .239** |
| Sig. | .002 | .017 | .000 | |
CC= Correlation coefficient; Sig = Sig. (2 label);**. Correlation is significant at the 0.01 level
*. Correlation is significant at the 0.05 level
Table 12 Spearman coefficient of correlation between daily expenditure variable and indicators corresponding to relational development and rational quality factors
| Variable | Relational development | Rational quality | ||||||
| Social Interaction | Affordable prices | Travel comfort | Easy to find locations | Practical public transportation | Attributes of service | Professionalism and skills that are demonstrated in customer service | ||
| Daily expenditure | CC | -.227** | .218** | .258** | .202** | -.231** | .301** | .358** |
| Sig. | .000 | .000 | .000 | .000 | .000 | .000 | .000 | |
CC= Correlation coefficient; Sig = Sig. (2 label);**. Correlation is significant at the 0.01 level
*. Correlation is significant at the 0.05 level
Table 13 Spearman coefficient of correlation between daily expenditure variable and indicators corresponding to responsibility factor
| Variable | Responsibility | |||
| Integrity | Discipline | Reciprocity | ||
| Daily expenditure | CC | .156** | .112* | .155** |
| Sig. | .002 | .025 | .002 | |
CC= Correlation coefficient; Sig = Sig. (2 label);**. Correlation is significant at the 0.01 level *. Correlation is significant at the 0.05 level
The variable "stay" influences aspects such as: sports and recreational activities, fun, party atmosphere, and arts and culture within the entertainment factor; expand horizons, needs for affection, self-fulfillment and emotional intelligence, within the factor of personal development; social interaction; and, accessible prices, comfort, ease of finding places, practical public transport, and professionalism in customer service, within the rational quality factor. The detail of the calculated values for the Spearman coefficient can be seen in Tables 14 to 16.
Table 14 Spearman coefficient of correlation between stay variable and indicators corresponding to entertainment factor
| Variable | Entertainment | |||||
| Fun and sport activities | Enjoyment | Party atmosphere | Shows and concerts | Arts and culture | ||
| Stay | CC | .125* | .111* | .340** | .199** | -.123* |
| Sig. | .012 | .026 | .000 | .000 | .013 | |
CC= Correlation coefficient; Sig = Sig. (2 label);**. Correlation is significant at the 0.01 level
*. Correlation is significant at the 0.05 level
Table 1 5 Spearman coefficient of correlation between stay variable and indicators corresponding to personal development and relational development factors
| Variable | Personal development | Relational development | ||||
| Expand horizons | Affective needs covered | Self- realization needs covered | Emotional intelligence | Social interaction | ||
| Stay | CC | .129** | .174** | .121* | -.140** | .332** |
| Sig. | .010 | .000 | .015 | .005 | .000 | |
CC= Correlation coefficient; Sig = Sig. (2 label);**. Correlation is significant at the 0.01 level
*. Correlation is significant at the 0.05 level
Table 16 Spearman coefficient of correlation between stay variable and indicators corresponding to rational quality factor
| Variable | Rational quality | |||||
| Affordable prices | Travel comfort | Easy to find locations | Practical public transportation | Professionalism and skills that are demonstrated in customer service | ||
| Stay | CC | -.127* | -.223** | -.145** | .275** | -.165** |
| Sig. | .011 | .000 | .004 | .000 | .001 | |
CC= Correlation coefficient; Sig = Sig. (2 label);**. Correlation is significant at the 0.01 level
*. Correlation is significant at the 0.05 level
In addition, study shows that depending on tourist nationality, motive that drives them to tell their experiences differs between prestige, pride, status, honor, respect, and self-realization. Likewise, educational level influences these reasons except self-realization, where no association between variables was found. The marital status of tourists, basically seems to influence four of the motivations studied: prestige, pride, honor, and respect. The calculated values of the Spearman coefficient can be seen in Table 17.
Finally, the correlation analysis between the total set of indicators and the indicator "satisfaction sensation", shows that the uniqueness attributes of destination constitute influential elements at the level of: unique resources, history and singularity of the place, particular climate, unique tourist products, quality of the unique environment and idiosyncrasy of the local people. Results also confirm that co-creation influences the sense of satisfaction as long as tourist had partaken on provision, creation, diffusion and/or consumption of services and products; and, have had the possibility of adapting product to their preferences in real time.
Table 17 Spearman coefficient of correlation between nationality, educational level, and marital status variables and indicators corresponding to motivational factor
| Variable | Motivation | ||||||||
| Prestige | Pride | Status | Appearances | Honor | Respect | Reputation | Self-realization | ||
| Nationality | CC | -.249** | -.232** | -.129** | -.142** | -.200** | -.227** | -.274** | -.116* |
| Sig. | .000 | .000 | 0.01 | .004 | .000 | .000 | .000 | 0.020 | |
| Educational level | CC | .188** | .167** | .178** | .185** | .180** | .160** | .205** | |
| Sig. | .000 | .001 | .000 | .000 | .000 | .001 | .000 | ||
| Marital status | CC | .112* | .149** | .105* | .119* | ||||
| Sig. | .024 | .003 | .036 | .017 | |||||
CC= Correlation coefficient; Sig = Sig. (2 label);**. Correlation is significant at the 0.01 level
*. Correlation is significant at the 0.05 level
Finally, it is also found that aspects of entertainment such as sports and recreational activities, nature and outdoors, fun, need for affection, and self-realization, cultural enrichment, and emotional intelligence, influence the feeling of satisfaction; as well as the affordable prices in the rational quality factor. The calculated values for the Spearman coefficient are shown below in Table 18.
Table 18 Spearman coefficient of correlation between feeling of satisfaction and selected variables
| Feeling of satisfaction compared to: | CC. | Sig. | |
| Uniqueness | Unique resources | .194** | .000 |
| History and singularity of the place | .182** | .000 | |
| Particular climate | .256** | .000 | |
| Unique tourism product | .223** | .000 | |
| Unique environmental quality | .163** | .001 | |
| Characteristic food of the place | .277** | .000 | |
| Unique idiosyncrasy of the people of the area | .290** | .000 | |
| Co-creation | Participation in the provision / creation / diffusion / consumption of services or products in Quito | .171** | .001 |
| Possibility to adapt the product to my preferences in real time | .158** | .001 | |
| Entertainment | Fun and sport activities | .170** | .001 |
| Outdoors and nature | .255** | .000 | |
| Enjoyment | .307** | .000 | |
| Arts and culture | .348** | .000 | |
| Personal development | Learning and education | .225** | .000 |
| Cultural interest | .224** | .000 | |
| Expand horizons | .124* | .013 | |
| Affective needs covered | .193** | .000 | |
| Self-realization needs covered | .132** | .008 | |
| Cultural enrichment | .294** | .000 | |
| Emotional intelligence | .198** | .000 | |
| Rational quality | Affordable prices | .170** | .001 |
CC= Correlation coefficient; Sig = Sig. (2 label);**. Correlation is significant at the 0.01 level
*. Correlation is significant at the 0.05 level
3.5 Importance-performance assessment of tourist experience in Quito
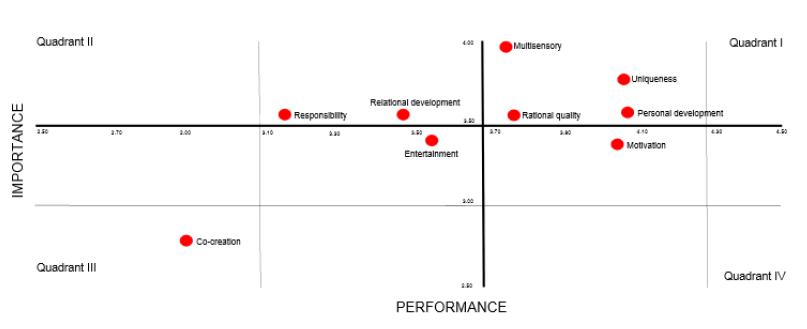
The evaluation of tourists’ experience in Quito through the matrix of importance- performance, shows that the dimensions uniqueness, multisensory, rational quality, and personal development are located in the first quadrant, which explains that the experience of tourists from these dimensions is equivalent to the importance given by them. In other words, it is considered that in these dimensions, Quito has offered the tourist what he has expected.
Likewise, the dimensions of relational development and responsibility are in the second quadrant, which translates as weak aspects of tourists’ experience in the sense that they are perceived below their expectations. Accordingly, opportunities for relational development and practice of values linked to responsibility in Quito have not been enough to be up to the importance they have in the perspective of the tourist who visits the city.
The dimensions of entertainment and co-creation are positioned in the third quadrant, which indicates that these variables are not considered by tourists as very important and at the same time, they have not been highly achieved in Quito either.
Finally, in the fourth quadrant is motivation as a dimension related to the desire to achieve experiences worthy of being communicated to friends and family. This is explained as an aspect to which tourists give little importance but which, nevertheless, has been perceived with a high valuation in the city. Figure 2 below shows the importance-performance matrix.
4 DISCUSSION
Based on hypothesis confirmation made in previous works by authors as: Martin, Castellanos and Oviedo (2010); Chen and Chen (2010), Rodríguez, Frías and Castañeda (2012); Naehyun, Lee and Lee (2015); and Cevdet & Erkut (2015); that places experience as a forerunner of consumer satisfaction in tourism, and assuming that a satisfactory experience is one that produces a high sense of satisfaction, it can be inferred within the framework of this investigation, that the tourist experience in Quito is highly satisfactory and is linked to 5 factors: uniqueness, co-creation, entertainment, personal development, and rational quality; measures by a set of 21 indicators for which statistical correlation was found and which are: unique resources, history and uniqueness of the place, particular climate, unique tourism products, quality of the environment, local food, unique idiosyncrasy of local people, participation in services and products, adaptation of the product to tourist preferences in real time, sports and recreational activities, nature and outdoors, fun, arts and culture, education and learning, cultural interest, expand horizons, needs for affection and self-fulfillment, cultural enrichment and emotional intelligence, and affordable prices.
5 CONCLUSIONS
This research establishes empirical validity of dimensions and indicators proposed by the authors Pulido and Navarro (2014), for the context of Quito as a destination and its tourist demand.
Results indicate that studied experience factors do not have the same importance for tourists surveyed; conversely, statistical differences were significant in 87.5% of the paired combinations of dimensions. This must be understood keeping in mind the type of destination that represents Quito (city) and its dominant product lines (urban and cultural), since the valuation could vary in other types. In this same aspect, it can be considered that none of the factors obtained a very high valuation, but rather a predominance of the high valuation was observed.
Characteristics of tourists as gender, age, educational level, marital status, and occupation; as well as travel preferences in terms of stay, daily expense, and mode of travel, influence the importance they assign to most factors of their experience (8 out of 9). These aspects represent valuable information with implications for products structuring and destination integral management. Correlation found among socio-demographic variables, suggests the implementation of differentiated strategies considering gender, age, educational level, occupation, nationality, and travel group to stimulate stay and the average daily expenditure.
Similarly, study provides key information for management, at the level of influential indicators of tourist satisfaction. Thus, it is found that the unique history of the city, the arts and culture are highly appreciated as aspects of the tourist experience in Quito, followed by local food and idiosyncrasies which should be protected to ensure their permanence over time. Along the same lines, other attributes of the city and the service that should be maintained are: nature and outdoors, recreational sports activities, fun, social interaction, prices, comfort, ease of location, quality and professionalism related to the service.
Tourists participation is the least valued aspect in the city, followed by public transportation, party atmosphere, and concerts and shows. This calls for reflection of the city tourist actors in order to take corrective actions. At an intermediate level, that is, oscillating between a high and a low valuation, there is the unique quality of the tourist product and the environmental quality of the city.
From an integral perspective of importance-performance, assessment of tourist experience in Quito reveal that into dimensions as uniqueness, multisensory, rational quality, and personal development, the tourist expectations are balanced with what they obtained during their trip; while dimensions as relational development and responsibility are perceived below their expectations.

