


 texto em
  Inglês (pdf)
 Artigo em XML
 Referências do artigo
 Enviar este artigo por email
 Citado por SciELO
  Similares em
SciELO
Similares em
SciELO 
 Permalink
1 INTRODUCTION
The objective of this study is to analyze the effect of hospitality, service quality, and experience marketing on the perception of satisfaction among lunchtime restaurant guests on weekdays in the city of São Paulo and on their loyalty.
People have distinct approaches to the act of eating. This characteristic is present in our personal as well as professional lives: sharing a table, i.e., the act of sharing food, drink or even establishing social relations, feelings and strengthening symbolisms. Carvalho, Bastos, and Gimenes-Minasse (2016), reinforced by Krause and Bahls (2016), point out that consumer evaluations are not restricted to only these aspects and this article addresses the aspects related to the perceptions of lunchtime restaurants customers on weekdays.
The pursuit of consumer satisfaction is inherent in the management of any business and mainly in small businesses, since the role of the manager is confused with that of the owner and his or her presence in the routine activities of the business and proximity with the customer (Hwang & Ok, 2013; Teng & Chang, 2013). This paper intends to analyze these aspects, specifically in restaurants at lunch in the city of São Paulo, on weekdays.
Choosing a place for lunch during the work week involves objective and subjective aspects. The cost, type of cuisine, service, distance, the physical space, among others, can be considered objective factors, while the perceptions of comfort, reliability, assurance, and feelings of well-being are subjective aspects.
From the perspective of hospitality, service quality and the experience while consuming the product are intimately related to satisfaction and thus loyalty. Therefore, this study is initially justified according to these aspects, and it is also worth emphasizing that the sector chosen for analysis deserves attention due to its economic relevance and importance.
The city of São Paulo is the region of the country with the highest concentration of bars and restaurants, approximately 60,000 establishment and more than 50 types of cuisine, employing around 780,000 people, with revenue amounting to more than BRL$ 30 billion in 2015 (Abrasel São Paulo, 2017). Therefore, it is an important sector of the Brazilian economy, thus justifying the present study.
The research process is dynamic and cyclical, and so this study does not intend to exhaust the topic, but to contribute to the improvement of the discussion on the topics of hospitality, service quality, experience marketing, satisfaction, and loyalty. We intend to contribute to the literature with a quantitative study that, in addition to the traditional subjects, includes experiential marketing, a little-explored topic in research.
2 THEORETICAL BACKGROUND
2.1 Hospitality
Hospitality originates from the human and interpersonal relationships that occur in public and private social environments. It involves the exchange between someone who welcomes (host) and, conversely, someone is welcomed (customer, guest), where the one who welcomes exchanges something with the one who is welcomed, whether they are tangible or intangible goods.
It is worth noting that hospitality can also be understood, in terms of a business activity, as: "the provision of food and drink, and, occasionally, accommodation for people who are not regular members of the house" (Telfer, 2004, p. 54). Consequently, hospitality, as a service offering, is addressed here in the commercial domain (restaurants) and is based on the premise that service management is concerned with the well-being of guests and, therefore, hospitality must contribute to better meeting their expectations.
In this study, the notion of hospitality involves human relationships represented by the host (employee, manager) and by the guest. Since hospitality refers to relationships between humans, we point out that a business is not hospitable by nature, but the staff may or may not be hospitable, mainly those who come in direct contact with guests.
Camargo (2015) explains that: "All cultures have principles, unwritten laws of hospitality, inherited from ancestral, unwritten rights that govern the human relationship in or out of the home" (Camargo, 2015, p. 47). By emphasizing the commercial aspect of hospitality, considering epistemological issues, Telfer (2004, p. 63) states that: "if a commercial host serves his guests well, with an authentic interest in their happiness, charging a reasonable, non-extortionate price for what is offered, their activities can be called hospitable". By analogy, we apply this claim by Telfer (2004) to a host in a restaurant, whether it is the owner, manager, or employee, and that will reflect on the guest’s perception.
Regarding the motivation of hospitality in the commercial environment, there is demand, since it is the customer who decides what he or she will consume, i.e., what he or she will eat or drink. "This gives the customer a greater degree of choice and control over the hospitality experience, to which the commercial hospitality provider must be able to respond" (Lockwood & Jones, 2004, p. 228).
While the social setting is the main focus of social hospitality, in the commercial setting, the focus is on the nature of the service experience that is paid for, and which, therefore, can be complained about if the client is dissatisfied. On the other hand, this is unlikely to occur in a social setting, since rarely does a guest complain to the social host. This can be explained since in the "commercial environment, hospitality is being offered for a price that provides at least financial sustainability and, perhaps, profit, and that values the customer, while in the social environment, the motivation for profit and money are not at stake" (Lockwood & Jones, 2004, p. 229).
Hospitable actions and the space created in the commercial domain represent the brand and personality features of the host (Camargo, 2015). Therefore, we can say that hospitable actions positively or negatively impact service. The study of hospitality has become increasingly apparent due to the pursuit of more professionalism in offering services. The performance of staff must add value to the businesses in collaborating towards distinguishing their products and/or services. (Wada & Camargo, 2006; Warech & Tracey, 2004)
The provision of hospitality in the commercial domain is interested in the "organization, dynamics and administration of the meeting/experience of hospitality, and how to improve it in different ways" (Brotherton & Wood, 2004, p. 201). Along these lines, we intend to find the effects of the demonstration of hospitality on delivering services offered in the environments studied, from the perspective of consumer perception.
The aspects of hospitality in restaurants were analyzed by McPhail, Patiar, Herington, Creed, and Davidson (2015) from the perspective of the employee. The present study will not exclude the importance of an analysis from that perspective, but adds the perspective of the guest using the scale developed by Blain and Lashley (2014).
Also from this perspective, Camargo (2004) claims that the greatest value added can be in 'how it is done', which makes all the difference in delivering services in the domains of hospitality (domestic, public, and commercial). This is because hospitality can be defined "as a human act practiced in a domestic, public and professional context, of welcoming, accommodating, feeding, and entertaining people temporarily displaced from their place of residence" (Camargo, 2004, p. 52).
Services related to hospitality should ideally reflect the pleasure of meeting new guests and greeting old ones that have re-turned. “[...] Courtesy and consideration for customers' needs apply to both face-to-face encounters and telephone interactions” (Lovelock & Wirtz, 2006, p. 88).
In a study by Teng and Chang (2013), hospitality was used as a mediating variable, regarding the value perceived by restaurant guests in relation to the products and services and, as addressed in the study by Grönroos (1984), to analyze restaurants indicating that guests are not only interested in the product, but they want to analyze the process itself.
Hospitality is fully demonstrated by interpersonal encounters that enable the creation of connections. In the commercial context, the hospitable aspects of the host indicate the way the service is offered and the manifestation of the perception of value on the part of the guest. It is not merely about attending to needs, but providing a memorable experience (Blain & Lashley, 2014; Lovelock & Wirtz, 2006; Lugosi, Lambie-Mumford, & Tonner, 2014).
Based on the above, we can claim that hospitable characteristics provide a competitive difference. Therefore, the study and identification of these characteristics can contribute to the development of strategies with the aim of meeting and surpassing the expectations of customers. The scale by Blain and Lashley (2014), which comprises three constructs (Guest First, Happy Guest and Special Guest) as presented in Frame 1, was used in this study to determine the hospitable characteristics in restaurants frequented for lunch during working hours in the city of São Paulo. The wording of the original scale by Blain and Lashley (2014) was adapted to the object of this study, with the set of constructs considered on a scale.
Frame 1 Scale of Hospitableness (Blain & Lashley, 2014) *
| Construct | Code | Variable Approach |
| Desire to put guests before yourself | HOSP_1CF | I put guests’ enjoyment before my own |
| HOSP_2CF | I do whatever is necessary to ensure that guests have a great time | |
| HOSP_3CF | I always try to live up to my idea of what makes a good host | |
| HOSP_4CF | The comfort of guests is most important to me | |
| Desire to make guests happy | HOSP_1CH | I get a natural high when I make my guests feel special |
| HOSP_2CH | I enjoy taking responsibility for the wellbeing of guests | |
| HOSP_3CH | It means the world to me when guests show their approval of my hospitality | |
| HOSP_4CH | It’s important to do the things that people expect of a good host | |
| HOSP_5CH | I seek out opportunities to help others | |
| Desire to make guests feel special | HOSP_1CE | When hosting I try to feel at one with the guests |
| HOSP_2CE | I try to get on the same wavelength as my guests | |
| HOSP_3CE | Guests should feel that the evening revolves around them | |
| HOSP_4CE | I find it motivating to take accountability for other people’s welfare |
* Original scale adapted.
Based on the above, the first hypothesis of this study is:
H 1 : The aspects of hospitality perceived by consumers in restaurants frequented at lunchtime during working hours in the city of São Paulo influence consumer satisfaction.
2.2 Service quality
The perception of service quality involves a range of factors that are normally measured and evaluated, such as: tangibles, reliability, responsiveness, assurance, and empathy of employees (Guiry, Scott, & Vequist, 2013). The evolution of means of communication has led to an upgrade in the forms of evaluating and perceiving quality among consumers. Therefore, websites, blogs, applications, and social networks have been increasingly present in the relation between evaluation among clients and service providers. (Aureliano-Silva, Oliveira, & Alves, 2017; Lee, Chiang, & Chen, 2012)
Specifically, in relation to services provided by restaurants, there are specific characteristics, such as: immediate consumption, and the ability of the guest to make comparisons, in addition to other characteristics inherent in service providing - quality of the product, service, environment, and price (Angnes, Moyano, & Lengler, 2015; Ryu & Lee, 2017). The study of perceived values and employee satisfaction would promote a higher standard of quality in service providing and causing the client to perceive this quality in the service provided, according to studies by Dhar (2015a, 2015b).
In his pioneering study, Grönroos (1984) claims that perceived quality in relation to restaurants is linked to the set of characteristics which, in the end, obtain the product/service and not only the product or service. In other words, "the consumer is not only interested in what he receives as an outcome of the production process, but in the process itself” (Grönroos, 1984, p. 36).
These characteristics stand out in relation to what restaurants deliver and raises the expectations of guests. Therefore, the perception of quality will be directly affected by the environment, service provided (employees), price, consumer loyalty, quality of raw materials, among other characteristics extrinsic to the product (Jung & Yoon, 2013; Kim & Jang, 2014; Stefanini, Souza, & Yamashita, 2012; Teng & Chang, 2013)
To assess this construct, we adapted and applied the SERVQUAL scale developed
by Parasuraman, Zeithaml, & Berry (1988), as presented in Frame 2, though the tangible construct was excluded from this study, since the variables had a weight of less than 0.50 after the first processing of the structural equation modeling with SmartPLS 3 software, as suggested by Hair, Black, Babin, Anderson, and Tatham (2010). This procedure is detailed in item 3.
The original scale by Parasuraman et al. (1988) was adjusted only in its wording to adapt to the object of this study, with the set of constructs considered on a scale.
Frame 2 SERVQUAL scale Parasuraman et al. (1988) *
| Construct | Code | Variable Approach |
| Tangibles*** | SERVQ_Tang1 | Modern looking equipment. |
| SERVQ_Tang2 | Attractive physical facilities. | |
| SERVQ_Tang3 | Employees are neat-appearing. | |
| SERVQ_Tang4 | Quality of the catalogs, manuals, and the signage of the place. | |
| Reliability | SERVQ_Conf5 | Maintenance of the services by the deadlines disclosed. |
| SERVQ_Conf6 | Interested in solving customer problems. | |
| SERVQ_Conf7 | Services are performed right the first time. | |
| SERVQ_Conf8 | Compliance with deadlines. | |
| SERVQ_Conf9 | Trade and customer records without errors. | |
| SERVQ_Conf16 | Staff very friendly with customers. | |
| Responsiveness | SERVQ_Prest10 | Employees correctly inform guests about service delivery. |
| SERVQ_Prest11 | Prompt service to customers. | |
| SERVQ_Prest12 | Staff willing to help customers. | |
| SERVQ_Prest13 | Staff always free to attend requests. | |
| Assurance | SERVQ_Seg14 | Employees’ behavior instils confidence in customers. |
| SERVQ_Seg15 | Staff well trained to serve customers. | |
| SERVQ_Seg17 | Employees have the knowledge to answer the questions. |
* Original scale adapted
*** Construct not applied in this study
Based on the above, the second hypothesis of this study is:
H 2 : The perceived quality in relation to restaurants frequented at lunchtime during working hours in the city of São Paulo in fluences the satisfaction of the restaurants’ clients.
2.2 Experience marketing
Meeting the needs of customers has been evolving and we see today that upon acquiring a product, customers expect something more, i.e., while the product is the final object of the negotiation, the purchasing process is one of the aspects of satisfaction. Therefore, the buying experience is a constantly evolving issue and this aspect is the focus of experience marketing. (Liu, 2016; Schmitt, 2010; Tynan & McKechnie, 2009; Walls, 2013).
The study of experience marketing according to Tarţa (2013) began with the concept of the “Experience Economy” by Pine and Gilmore (1999), defined by the authors as the satisfaction generated in a buying experience, in which the senses, comfortable environment, a personalized experience, and the creation of unique values in the buying process play important role (Liu, 2016; Pine & Gilmore, 1999; Tarţa, 2013)
Experience marketing involves various aspects and is not limited to a single dimension. Maghnati, Ling, and Nasermoadeli (2012), based on studies carried out by Schmitt (1999), address five dimensions that characterize the buying experience, namely: senses, emotions, feelings, actions, and relevance, as in frame 3 (Liu, 2016; Maghnati et al., 2012; Schmitt, 1999, 2010; Tarţa, 2013). The wording of the original scale by Liu (2016) was adapted to the object of this study, with the set of constructs considered on a scale.
Therefore, consumer satisfaction can be characterized by several factors and hedonic aspects are also present, since, according to Farias (2005), Farias and Santos (2000), and Westbrook and Oliver (1991), emotions lead the consumer to another stage in the moment of buying and feelings like pleasure, relief or relaxation, emotion, and these feelings merge at the time of consumption, creating feelings unrelated to the functional need for the product or service. Consequently, this paper contextualizes and analyzes the stimuli proposed by experience marketing.
Frame 3 Experience Marketing Scale*
| Construct | Code | Variable Approach |
| Sense | MKT-EXP_SENSE1 | Architecture and decoration refer me to an exotic environment. |
| MKT-EXP_SENSE2 | Creative installations stir emotions and good memories. | |
| MKT-EXP_SENSE3 | I learn with themed proposals in the restaurant. | |
| MKT-EXP_SENSE4 | I enjoy and have fun with art in this restaurant. | |
| MKT-EXP_SENSE5 | Comfortable and reliable accommodation. | |
| MKT-EXP_SENSE6 | I feel relaxed, transported in time and environment. | |
| Emotion | MKT-EXP_EMOT7** | The impression is improved by service provision. |
| MKT-EXP_EMOT8 | Restaurant with creative and well decorated spaces. | |
| MKT-EXP_EMOT9 | Restaurant with a quiet atmosphere to eat. | |
| MKT-EXP_EMOT10 | Nice atmosphere and good-looking food. | |
| MKT-EXP_EMOT11 | Spacious and comfortable restaurant. | |
| Thought | MKT-EXP_THINK12 | The ambience and the architecture surprise me. |
| MKT-EXP_THINK13 | Thematic dishes allow you to understand about the culture of countries. | |
| MKT-EXP_THINK14 | Festivals and typical events to know more other cultures. | |
| Action*** | MKT-EXP_ACTION15 | Offer of festivals and events related to other cultures. |
| MKT-EXP_ACTION16 | Ecological events attract more customers. | |
| MKT-EXP_ACTION17 | Marketing actions in the restaurant are more attractive. |
Source: Liu (2016)
* Original scale adapted.
** Variable excluded from the construct after the first SEM calculation, because it presented a load lower than 0.70 as suggested by Hair, Ringle, & Sarstedt (2011).
*** Construct not applied in this study.
Based on the above, the third hypothesis of this study is:
H 3 : Related experience marketing positively influences the perception of consumers in restaurants frequented at lunchtime during working hours in the city of São Paulo regarding satisfaction.
2.3 Satisfaction and Loyalty
The literature on the perception of service quality is extensive and various studies refer to customer satisfaction as an outcome. The aspects of perception of quality and repeat purchase intentions, as a result of this satisfaction, are usually present in these studies. (Namkung & Jang, 2017; Shing, Koh, & Nathan, 2012; Werdini, Rejowski, & Stefanini, 2014)
Given that dissatisfied clients look for another service provider, identifying the factors that lead clients to obtain a service and their satisfaction is fundamental for the success of businesses. Therefore, satisfaction and loyalty are intimately related, and loyalty is a consequence of satisfaction. (Angnes et al., 2015; Johnson, Gustafsson, Andreassen, Lervik, & Cha, 2001).
The loyalty of restaurant guests is dynamic and despite cultural differences, as pointed out by Kim, Lee, and Mattila (2014), where Asian customers, contrary to westerners, do not verbalize their opinion, loyalty is intimately linked to satisfaction.
Frame 4 Satisfaction Scale Parasuraman et al. (1988) *
| Construct | Code | Variable Approach |
| Satisfaction | SERVQ_Emp18 | Satisfied with the individual attention to customers. |
| SERVQ_Emp19** | Satisfied with the opening hours (convenient). | |
| SERVQ_Emp20 | Satisfied with the staff (in quantity and quality) | |
| SERVQ_Emp21 | Satisfied by the treatment of customer interests with priority | |
| SERVQ_Emp22 | Satisfied to meet specific needs. |
* Original scale adapted.
** Variable excluded from the construct after the first SEM calculation, because it presented a load lower than 0.70 as suggested by Hair, Ringle, & Sarstedt (2011).
Frame 5 Loyalty Scale (Srinivasan, Anderson, & Ponnavolu, 2002) *
| Construct | Code | Variable Approach |
| Loyalty | Leal1 | I will continue to buy from this store. |
| Leal2 | I would recommend this shop to relatives and friends. | |
| Leal3 | I consider myself loyal to this store. |
* Original scale adapted.
Based on the above, the fourth hypothesis of this study is:
H 4 : The perception of satisfaction in relation to restaurants frequented at lunchtime during working hours in the city of São Paulo influences the loyalty of clients of these restaurants.
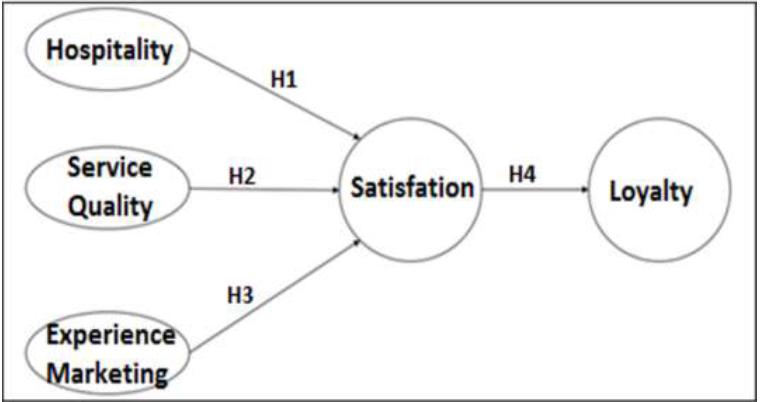
Based on the presentation and the conceptual basis of the constructs, scales, and hypotheses, we present in Figure 1 the research model to be tested in this study.
3 METHODOLOGICAL PROCEDURES
In the present article, we intend to analyze the influence of hospitality and service quality on guest satisfaction in commercial restaurants in the city of São Paulo and their loyalty to the restaurant they visit on weekdays at lunchtime.
This study used non-probability convenience sampling. Non-probability because the questionnaires were sent randomly without the use of statistical procedures for selecting subjects, and convenience, since we considered those guests that were willing to participate in the research. (Fávero, Belfiore, Silva, & Chan, 2009)
For data collection, we used the Google Docs® platform through the forms tool. The period of data collection was between March and April, 2017 in the city and the metropolitan area of São Paulo. The researchers sent the link of the questionnaire to their group of contacts and requested that these respondents then send it to their contacts, a technique known as snowball sampling (Creswell, 2013).
The cut-off question for respondents was whether they had lunch at some restaurant on weekdays. The questionnaire had 58 questions, 7 of which were descriptive questions to characterize the sample and 51 statements on a seven-point Likert scale, (1) totally disagree - (7) totally agree, as presented in Frame 1, 2, 3, 4, and 5.
For this research, we adapted three scales, previously tested and validated originally, to the object of study, namely: service quality known as SERVQUAL. We used the constructs of tangibles and reliability by Parasuraman et al. (1988) Frame 2, hospitality by Blain and Lashley (2014) Frame 1, satisfaction through the construct employees from the SERVQUAL scale by Parasuraman et al. (1988) Frame 4, and the construct loyalty by Srinivasan et al. (2002) Frame 5. To validate the proposed model, after defining the scales, we validated the grouping of variables using confirmatory factor analysis.
Confirmatory factor analysis or common factor analysis is a multivariate technique of interdependence that aims to summarize the relations observed between a set of interrelated variables, to identify common factors. The basic idea lies in the premise that it is possible to represent a set of original variables observed through a smaller number of intrinsic factors. The variables from the scales were tested and the results confirmed their adherence to the factors indicated as constructs. (Hair, Black, Babin, Anderson, & Tatham, 2010)
At the end of the period of data collection, we observed that more than 307 consumers participated in the study, though only 269 questionnaires were validated, since some of the participants did not regularly visit restaurants and so they were excluded.
This study is defined as descriptive quantitative, using non-probability convenience sampling. The multivariate data technique used was structural equation modeling using the SmartPLS 3 software (Ringle, Wende, & Becker, 2015). For the data analysis, we used the multivariate data analysis technique Structural Equation Modeling (SEM). According to Hair et al. (2010, p. 36), “[...] structural equation modeling provides the appropriate and most efficient estimation technique for a series of separate multiple regression equations estimated simultaneously [...]”.
Moreover, Hair et al. (2010, p. 543) state that “SEM is a family of statistical models that seeks to explain the relationships among multiple variables” (Hair et al., 2010; Hair, Ringle, & Sarstedt, 2011).
The proposed model with its respective variables are presented in Figure 1. There are three dependent constructs (Service quality, Hospitality, and Experience marketing) and the independent variable is Satisfaction. The model also includes Loyalty as a result of customer satisfaction.
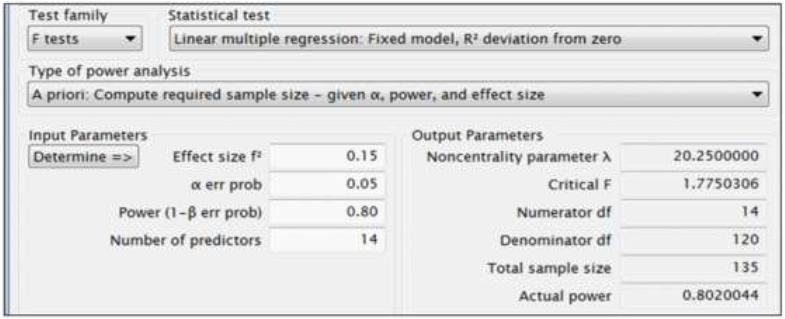
In this study, we examined the statistical power of the sample to analyze the probability of the null hypothesis to be rejected, i.e., when this hypothesis is false (Cohen, 1977). The statistical power analysis involves the relation between four variables, namely: sample size (N), the significance criterion (α), the effect size of the population (ES) and statistical power. (Erdfelder, Faul, & Buchner, 1996; Faul, Erdfelder, Buchner, & Lang, 2009)
The first analysis, referred to as a priori, is used in planning the research and aims to identify N as a function of the other three variables (α, ES, and statistical power). Using the G*Power3 software, this test was run using the following parameters: effect size = 0.15, considered medium by Cohen (1977), α-value = 0.05, statistical power = 0.80 and predictors = 14 (experience marketing), considering the construct with the greatest number of variables (Hair et al., 2010). As presented in Figure 2, the minimum sample necessary in this study would be 135 participants. Therefore, this study meets this criterion, since the sample had 269 participants.
The post hoc test to analyze the statistical power based on the values used in this study (ES= 0.15, α-value= 0.05, N= 269 and predictors= 14) attained the value of 0.9942, in other words, surpassing the assumed value (0.80), as in Figure 3. (Cohen, 1977; Erdfelder, Faul, & Buchner, 1996; Hair et al., 2010)
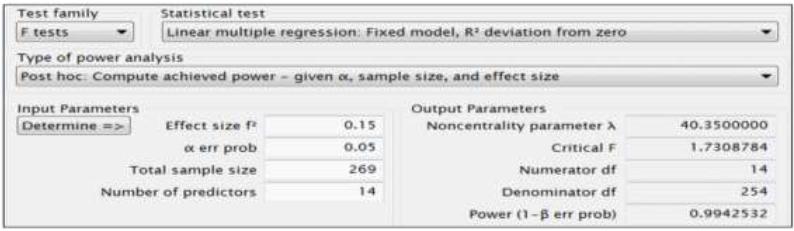
Therefore, the power of the sample is considered high. It is worth highlighting that prior to calculating the statistical power of the sample, it was submitted to an analysis in relation to its aspects, such as: response pattern, missing data, outliers, and distribution of data (Erdfelder et al., 1996; Faul et al., 2009).
In the next section, we present the results obtained based on the fieldwork and analyzed them using SmartPLS 3 software which, according to Ringle et al. (2015), aims to test the validity of the proposed model.
3.1 Presentation and analysis of the results
Based on the data from the fieldwork presented in Table 1, we can see that the sample is predominantly composed of women 60.59%, with a higher education degree 50.56% or graduate education 43%, age range from 31 to 50 years 55.39% and 68.03% of the respondents spent an average of BRL$ 20.01 to BRL$ 50.00 on lunch. Therefore, we can claim that, in this study, the main group of respondents was female, with higher education, adult and with a daily expense of up to BRL$ 50.00. We observed that “buffet per Kilo” type of restaurant was predominant among the respondents in this study (72.86%).
Table 1 Descriptive statistics
| Frequency | Percentage | |
| Education | ||
| High School Completed or Incomplete | 16 | 5.95% |
| Under graduation Completed or Incomplete | 136 | 50.56% |
| Graduation Completed or Incomplete | 117 | 43.49% |
| Average value of each meal | ||
| Up to BRL$ 20.00 | 80 | 29.74% |
| From BRL$ 20.01 to BRL$ 50.00 | 183 | 68.03% |
| From BRL$ 50.01 to BRL$ 80.00 | 5 | 1.86% |
| More than BRL$ 80.01 | 1 | 0.37% |
| Your age group | ||
| Up to 30 years | 88 | 32.71% |
| From 31 to 50 years | 149 | 55.39% |
| Above 60 years | 32 | 11.90% |
| Gender | ||
| Female | 163 | 60.59% |
| Male | 106 | 39.41% |
| Type of Restaurant | ||
| Traditional buffet per kilo | 196 | 72.86% |
| Restaurant type single price | 32 | 11.90% |
| Fast food restaurant | 14 | 5.20% |
| Network restaurant (except fast food) | 10 | 3.72% |
| Company's Restaurant | 5 | 1.86% |
| Vegetarian restaurant | 5 | 1.86% |
| A la carte restaurant | 4 | 1.49% |
| Steakhouse Restaurant | 3 | 1.12% |
Source: Research data (2017)
For the elaboration of the structural equation modeling, we initially determined the validity of the model. In this study, we determined the validity using Cronbach's Alpha, Composite Reliability, and Average Variance Extracted, presented in Table 2, analyzed with the SmartPLS 3 software, with the objective of testing the validity of the proposed model, and explained below.
Average Variance Extracted (AVE), according to Hair et al. (2010, p. 589) is “a summary measure of convergence among a set of items representing a latent construct. It is the average percentage of variation explained among the items”. Also, according to Hair et al. (2010), to suggest an adequate convergent validity, AVE must be greater than or equal to 0.50. Therefore, all constructs had an adequate convergent validity.
Composite Reliability is a measure of the general reliability of a collection of heterogeneous, but similar, items (Hair et al., 2010). The results of this measure are above 0.70 (Table 2), which suggest general reliability, following (Hair et al., 2010).
According to Hair et al. (2010, p. 100) “Cronbach's Alpha is a measure of reliability that ranges from 0 to 1, with values of 0.60 to 0.70 deemed the lower limit of acceptability”. For this study, we used the acceptance criterion in relation to Cronbach's Alpha minimum 0.70. As presented in Table 2, the values of all constructs were acceptable based on this criterion.
The discriminant validity of the latent variables was proven, when we determined that the square root of each variable is higher than the correlation between them and the other latent variables of the models (Fornell & Larcker, 1981). The model presents only one variable that does not meet the assumption, as shown in Table 3.
Table 2 Construct Reliability and Validity Indicators
| Construct | Cronbach's Alpha | Composite Reliability | Average Variance Extracted (AVE) |
| Hospitality | 0.965 | 0.969 | 0.704 |
| Loyalty | 0.877 | 0.924 | 0.802 |
| Experience Marketing | 0.948 | 0.954 | 0.615 |
| Service Quality | 0.946 | 0.952 | 0.539 |
| Satisfaction | 0.876 | 0.916 | 0.731 |
Source: Research data - SmartPLS (2017)
Table 3 Discriminant Validity
| Construct | Hospitality | Loyalty | Experience Marketing | Service Quality | Satisfaction |
| Hospitality | 0.839 | ||||
| Loyalty | 0.635 | 0.895 | |||
| Experience Marketing | 0.555 | 0.466 | 0.784 | ||
| Service Quality | 0.796 | 0.783 | 0.560 | 0.734 | |
| Satisfaction | 0.829 | 0.684 | 0.578 | 0.873 | 0.855 |
Source: Research data - SmartPLS (2017)
Since only one variable in the discriminant validity did not meet the assumption (Service Quality) and the other adjustment indexes had optimal values, we decided to continue the analysis of the structural model and test the hypotheses.
Based on the analysis presented, we can claim that there is validity and reliability for the proposed model, since these presented values above the minimum for ac-
ceptance. Figure 4 presents the final satisfaction model in relation to the restaurant frequented at lunchtime during the week. This model is responsible for 83.7% of the perception of satisfaction in relation to the restaurant, and satisfaction is responsible for 46.8% of loyalty, values considered expressive in social science research, according to Oliveira, Silva, Rodrigues, and Borges (2014).
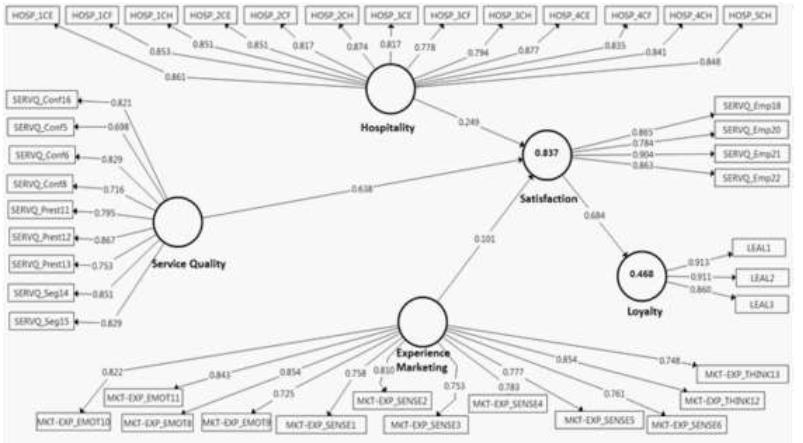
The proposed research model in this study was applied and analyzed. Figure 4 presents the results of the modeling, in which it is possible to determine that this model explains 83.7 % of the factors involved in the consumer satisfaction of this client and 46.8% of the loyalty. The observed effect re-
fers to the analysis carried out by Arsham (1988), which classifies the observed effect on the hypothesis as very strong evidence (p≤0.01), moderate evidence (0.01≤P<0.05), suggestive evidence (0.05≤P<0.10) and little or no real evidence (0.10≤P).
Table 4 Evaluation of the Hypothetical Structural Model (R2 = 0.837)
| Hypothesis - Relationship | β | p-values | Hypothetical Effect | Observed Effect | Result (Hypothesis) | |
| H1 | Hospitality -> Satisfaction | 0.249 | 0.000* | Positive | Strong | Supported |
| H2 | Service Quality -> Satisfaction | 0.638 | 0.000* | Positive | Strong | Supported |
| H3 | Experience Marketing -> Satisfaction | 0.101 | 0.0180 ** | Positive | Moderate | Supported |
| H4 | Satisfaction -> Loyalty | 0.684 | 0.000* | Positive | Strong | Supported |
Source: Research data- SmartPLS (2017)
Note: *p≤0.01, ** p≤0.05, R2= 0.837
The results presented here appear to support the hypotheses, though it is important to go beyond the numbers to explain these results, as previously mentioned by Carvalho et al. (2016). The action of sharing, food, drinks or even the establishment of social relations, feelings, and the strengthening of symbolisms, consequently, the results presented here can represent aspects that go beyond the cold analysis of the results. Initially, to analyze the aspects proposed in this article, we addressed four hypotheses, which are analyzed below.
There are indications that Hypothesis H1 (the perception that hospitality in restaurants influences guest satisfaction) is supported by the results in this study (Table 3), so we can claim that guests associate satisfaction to the service provided and to aspects of hospitality, confirming the studies by Teng and Chang (2013).
The aspects of hospitality examined based on the scale developed by Blain and Lashley (2014) with the constructs of the happy guest, special guest, and guest first, and applied in this study were identified and indicated that Hypothesis 1 is supported. These aspects confirm the results found in various studies, such as: the value perceived by customers, also present in the study by Teng and Chang (2013), or in the perception of value through the product delivered (Brotherton & Wood, 2004) or even by the claim by Telfer (2004) when referring to the amount charged to be fair for what is given.
Still focused on hospitality, we can claim that based on the focus on the employee, there is added value in the service provided, whether through the personality features of the host (Camargo, 2015), courtesy (Lovelock & Wirtz, 2006), the performance of the employee adding value to the service provided (Wada & Camargo, 2006; Warech & Tracey, 2004), or even specifically in a study on restaurants developed by McPhail et al. (2015), in which employees have a fundamental role in the perception of hospitality. Therefore, as presented, various studies confirm the results presented here regarding Hypothesis 1, consequently justifying its acceptance.
The second hypothesis (H2) addressed the aspects of service quality influencing satisfaction of clients in restaurants and there are indications that support this hypothesis, despite various studies having already addressed this relation. The scale assessment is important in other types of services, environments, and consumers, since the scales undergo alterations resulting from translation or in the adaptation of the object of study. We reinforce the idea that academic research is a means and not an end, and therefore, there should be a constant evolution in thought.
The results presented indicate that the hypothesis can be supported here as well as in other studies. The scale used was SERVQUAL (Parasuraman et al., 1988) and the constructs used were reliability, responsiveness, and assurance, as previously mentioned. In these characteristics, we can claim that the hypothesis is supported, confirming the results of the studies by Guiry et al. (2013) and Stefanini et al. (2012).
In relation to the service provided, we can claim that the results found corroborate the studies by Dhar (2015a; 2015b). Beyond the service provided, if we include the quality intrinsic in the product, as analyzed by Jung and Yoon (2013), Kim and Jang (2014), and Teng and Chang (2013), the characteristics inherent in service are present in the studies by Aureliano-Silva et al. (2017) and Lee et al. (2012), as well as in the studies by Angnes and Moyano (2013) and Angnes et al. (2015), and finally, the set of characteristics that make a difference in the business was researched by Grönroos (1984). Based on the above, we intend to support the claim of Hypothesis 2, in which the service quality has a positive effect on client satisfaction in restaurants.
The third hypothesis (H3) concerned the aspects of experience, based on studies by Schmitt (1999; 2010), which address satisfaction as a consequence of the evolution of the buying experience, i.e., the customer, though unconsciously, desires something beyond the product or service that is being purchased (Liu, 2016; Schmitt, 1999, 2010; Tynan & McKechnie, 2009; Walls, 2013). This hypothesis was confirmed, as shown in Table 3 at the significance level of 5%.
We intended to analyze the aspects that go beyond the acquisition of a product or service, i.e., the buying experience in a routine situation of this consumer. We used the scale developed by Liu (2016), which contains the constructs of sense marketing, feel marketing, act marketing, think marketing and relate marketing. This scale is an evolution of the scale initially developed by Schmitt (1999; 2010).
Despite experience marketing being a new topic for study, mainly in Brazil, we observed in various studies its relevance and timeliness, given its focus on the buying experience, as previously reported in studies by Liu (2016), Schmitt (1999; 2010), Tynan and McKechnie (2009), and Walls (2013). Or even the importance of the experience economy, following the studies by Pine and Gilmore (1999) and Tarţa (2013), reinforcing and corroborating the acceptance of the hypothesis, since customers are interested in the products and services that go beyond the purchase and its dimensions (Maghnati et al., 2012), such as sense, emotion, feeling, or actions (Liu, 2016; Maghnati et al., 2012; Schmitt, 1999, 2010; Tynan & McKechnie, 2009).
Finally, the fourth hypothesis (H4) of this study analyzed the influence of satisfaction in client loyalty in restaurants visited during working hours in the city of São Paulo. This hypothesis was confirmed, as presented in Table 3 satisfaction. We determined a total variance explained of 0.837, i.e., 83.7% of the dependent variable can be explained by the regressors present in the model.
Satisfaction generating loyalty can be corroborated by the studies by Angnes et al. (2015) and Johnson et al. (2001). Loyalty apparently is a consequence of satisfaction, though not always do clients repeat this behavior, since other variables, such as price, duration, customer expectation, among other factors can influence their behavior. The hedonic aspects, such as those analyzed by the construct of experience marketing, can explain this behavior of satisfaction, but not necessarily the creation of customer loyalty (Farias, 2005; Farias & Santos, 2000; Westbrook & Oliver, 1991).
Consumer loyalty involves factors that are not always possible to identify and capture with a quantitative study. The result presented here demonstrates this observation well, since, despite an R2 of 0.837 for satisfaction, we observed the value of 0.468 for loyalty (Table 3). Therefore, satisfaction does not necessarily lead the consumer to being loyal and the intention to buy again demonstrates the desire of the consumer to repeat the purchase and, therefore, generate their loyalty (Kim, Lee, & Mattila, 2014; Namkung & Jang, 2017; Shing, Koh, & Nathan, 2012; Werdini, Rejowski, & Stefanini, 2014).
In the analysis of the hypotheses presented, there are indications that they are supported (Table 3), though it is necessary to point out that some aspects are not visible in these quantitative results and deserve emphasis. The first point is the fact that the research portrays a routine situation among São Paulo residents, though with a relevance that is unlikely to be portrayed without emphasizing the ritual of eating in this population, since even the moment for coffee is relevant. Therefore, choosing the place, the type of food, and the company for lunch carries a very heavy weight and deserves to be highlighted in this study. This way, it is important to report the confirmation of these hypotheses or not, as well as to point out these characteristics.
4 FINAL CONSIDERATIONS
The objective of this study was to analyze the effect of hospitality, service quality, and experience marketing on the perception of guest satisfaction in restaurants frequented at lunchtime during working hours in the city of São Paulo and their loyalty. To this end, we used structural equation modeling to observe this relation, as well as to analyze the hypotheses and, consequently, achieve the proposed objective.
The sample of this study was predominantly female, with higher education or graduate education, aged between 30 and 50 years, going to “buffet per kilo” type restaurants and an average expense of BRL$ 30.00 to BRL$ 50.00 per meal, as shown in Table 1. It is worth noting that the results presented here are specific to this sample, without a claim of generalization, though we must emphasize its relevance due to the lack of studies on this population.
Studying aspects regarding the perception of service quality and hospitality is relatively common in studies focused on consumer behavior, though this paper adds a new topic to the studies that has yet to be fully explored, experience marketing, in addition to incorporating multivariate techniques and adapting scales validated in other areas and in another language for national academic research, facilitating their application and adaptation by local researchers and students.
As discussed in the previous chapter, there is evidence to claim that the hypotheses have been confirmed, since the results presented in Table 3 reinforce their acceptance. However, it is important to highlight that quantitative results, despite validating the hypotheses, should always be considered with caution and any generalizations must be made with care. Moreover, the results obtained represent a point of analysis to inform managerial and strategic decisions, or even decisions for routine resource planning. Other analyses that can explain or present different points of view must be incorporated to this analysis to increase its value, to distinguish specific characteristics, or even to propose alternatives to decisions made and, therefore, improve the competitiveness of the business.
This research adds a different focus to the literature on consumer behavior, specifically in the aspects regarding hospitality, in addition to presenting an emerging topic in the literature, experience marketing. Despite little research on the topic, mainly in Brazil, it has been increasingly present in studies on consumer behavior. For future research, one can apply the multigroup analysis to structural equation modeling (Multi-group Analysis - MGA), by means of which it will be possible to identify differences between groups, such as men and women, age groups, social classes, or other types of groups. Based on the research carried out and in relation to managerial aspects, we suggest special attention by managers in providing resources aimed at training employees, maintaining assurance and hygiene standards, in addition to the quality of the products provided to clients.

