


 Inglês (pdf)
 Artigo em XML
 Referências do artigo
 Enviar este artigo por email
 Citado por SciELO
  Similares em
SciELO
Similares em
SciELO 
 Permalink
1. Introduction
The importance of tourism gainingrelevance as engine of the economiesaround the world is indisputable.Nowadays, a country whichdoes not develop its tourism industry becomes a less competitive economyand loses the opportunity to obtain higher incomes to help its growth.
Because of the advantages that tourism represents for countries, the global competition has intensified, forcing the tourism industry to be under a constant change in attempt to satisfy the clients’needs by creating new segments and specialized offers and adapting itself to the market. Moreover, the diversity of touristic products allows such industry to offer different options for any kind of tourists. Nevertheless, people have to struggle with the toughdecision about which destination will be their best choice.On the other hand, there are countries without enough sources or the capability to react on time to adapt to the dinamism of this industry, making them lose competitiveness in a short time or perhaps leave the market.
The Asia-Pacific Economic Cooperation (APEC), is a regional economic forum created in 1989 with the aim of promoting a greater prosperity for the people of the region by ensuring that all kind of resources move easily across the borders. Is integrated by 21 countries which influence the global economydue to the fact that they constitute about half of the world’s population, they generate 44% of the global commerce and represent the 55% of the global GDP. Therefore, itis interesting to analyze their participation and performance in the tourism industry, considering that the group is formed by countries located in different continents and they possesssundry resources, culture and levelof development (APEC, 2013).
While for some APEC countries the tourism constitutes one of their economic pillars or even their principal income source, for othersit is just a complementary activity from which they receive an extra profit.
Regarding Mexico, its GDP is composed by primary activities (4%), secondary activities (32.9%) and tertiaryactivities (63.1%) –in which tourism and related activities are included. Consequently, for the Mexican economy, tourism represents an important source of income, just after the petroleum and remittances (INEGI, 2015).
For such reason, it is preoccupying that Mexico has fallen several places in the tourism competitiveness ranking of the World Economic Forum (WEF), and has not registered any important growth since 2011. Additionally, it left the top 10 ranking in international tourist arrivals, while the Asian and Latinamerican countries continue to have a significant increase in their tourism activities, positioning themselves more and gaining a greater market share.
Finally, after three years out of the Top Ten destinations in the world, Mexico is back in tenth position, which means is gaining competitiveness again in the tourism industry (UNWTO, 2015)
Eventhough Mexico is one of the principal countries that receive a greater number of international tourist arrivals, the profits obtainedare less than those obtained by other APEC countries. Despite its diversity of natural and cultural resources and the fact that different aspects of its tourism industry have been improved, within the 22 years that Mexico has pertained toAPEC, it has not yet been able to establish itself as one of the main tourist destinations in the region, whileAsian competitors have been the main beneficiaries of the tourism activity in the region right after the United States, the great leader of the group.
Therefore, it is necessary to conduct an investigation to identify what resources from the 21 APEC countries are decisive in their tourism competitiveness and which ones directly affect their performance in the region. Thus, a comparison with Mexico might be made for determining its competitiveness in Asia-Pacific region.
The research seeks to understand why, in spite of having a number of factors for being a potential leader country in this segment; Mexico has not reached that position in Asia-Pacific.
The aim of this investigation is to identify the factors that determined Mexico’s tourism competitiveness inside APEC, the world´s most dynamic region in economics and international commerce through a hierarchical cluster analysis. It is interesting to discover whether the performance of the tourism industry has relationship with these factors.
Also, the results will release the similarities and dissimilarities of the APEC countries tourism destinations that will contribute as a start point in three branches. First, cluster analysis allows inferring that there is a correlation between the variables that makes an Asian-Pacific country competitive in its regional tourism industry. Second, results will give light to governments and investors in the region to know better which variables they should promote to increase their possibilities of becoming competitive.
Finally, further research is recommended applying the same methodology and variables to other regions like Latin America and Caribbean to compare results and be sure which variables of the 14 analyzed are suitable for a country to become a competitive destination.
2. Literature Review
Tourism history goes back to the origins of the human race. Because oftheir nomad condition they were forced to travel long distances to get enough food and have a more favorable climate to survive. Later, during Ancient times, people used to move to find better living conditions, because of their jobs, trade or military activities (UNWTO, 2015).
During the Middle Age, due to the influence of the Catholic Church, tourism basically was confined to religious pilgrimages and it was not until the Industrial and French Revolutions occurredthat the payment and work conditions for employees started to change, so they could be entitled to take days off and increase their income to leave their places of origin (UNWTO, 2015)
It can be said that tourism as it is known today emerged in the middle of the last century due to the combination of several factors (BELTRAMI, 2011):
Global stability after 2 World Wars.
Creation of International organizations like the United Nations.
The recovery of Germany, becoming one of the most important countries in Europe.
Consolidation of fundamental labor rights, such as a laboral journey of 40 hours a week.
Periods of unemployment, compensation and remuneration for the holidays.
Recognition of congestion and poor welfare in most European cities, due to the good weather of the south, choosing its beaches as the ideal place for recovery.
Increase of the living standard and purchase power, consolidating the middle class.
Emergence of intermediary companies, encouraging “mass tourism”.
Emergence of advertising companies with advanced techniques whichproduced great impact on society, which incited tourism consumption and encouragedpeopleto visit diferent places in the world and get to know their culture.
In 1994 the World Tourism Organization defined the concept of tourism as follows: “Tourism comprises the activities undertaken by persons traveling to and staying in different places outside their usual environment for a period of time bottom row a year for leisure, business and other”.
For about 20 years, travel and tourism has become one of the major export products in the world, including all its services: hotels, restaurants and other businesses that have contributed to a global multibillion industry (RINGBECK & PIETSCH, 2011).
The tourism industry is extremely sensitive to economic and social events that occur both in the host country and in the world. In 2008, the economic crisis severely affected tourism,decrreasing the number of international travelers.This had serious consequences for the industry, including the mature-people tourism,traditionally characterized by U.S and European destinations, because they stopped receiving the same amount of international tourist arrivals, leading emerging economies to be recognized as new tourist destinations.
While Europeans adopted the practice of regional or local tourism, several countries in Asia and
Latin America grew rapidly, positioning themselves as the best options to visit during holidays. The factor of the rapid growth of the middle class in these countries and the strong commitment of their governments to support tourismshould also be considered (BLANKE & CHIESA, 2011).
The World Travel and Tourism Council (WTTC) estimates that from the combination of direct and indirect activities, tourism sector currently accounts for 9.2% of the global GDP, 4.8 of world exports and 9.2% of the world investments, returning to the same position they had before the 2008 crisis.
A solid tourism sector may contribute to employment opportunities, increase national income and improve the balance of payments. Therefore, it is an important vehicle for development and prosperity for a country. Especially for those developing countries it may constitute a significant reduction in poverty (BLANKE & CHIESA, 2011).
During the 90’s decade, Western Europe and North America were the most important markets regarding travel expenses. However, in the last decade they have decreased and other countries like China have withold the same flow for years (RINGBECK & PIETSCH, 2011).
In 2000, Western Europe and North America accounted for 70% of the grand total personal spending on travel, but in 2010 it decreased to 62%, decreasing about 1% annually in North America and 0.7% in Western Europe (RINGBECK & PIETSCH, 2011).
Moreover, the tourist industry has been subject to constant price competition. This situation forced the industry to take advantage of new distribution channels and internet to establish new business models and reach to offer lower prices (RINGBECK & PIETSCH, 2011).
This situation prompted the tourists to stop travelling to traditional destinations and began to seek other options that offered more advantages for the same value they were used to pay. Therefore, tourism strategies nowadays should be based on diversification.
Although there is an improvement in the global economy, the tourism industry will continue to face the volatility of travelers’ demands caused by the vagaries of the international economy, economic policies, volatility in oil prices, the cost of coal, environmental regulations, currency fluctuations, pandemic outbreaks, terrorist attacks and political turmoil (RINGBECK & PIETSCH, 2011).
3. Tourism in Mexico
Because of its privileged geographical position, Mexico has been favored by a number of factors that represent a comparative advantage over other actors in international tourism, since it has a wide biodiversity and different climates that allow the development of various specialized resorts. Therefore, Mexico has a clear tourism vocation.
In order to generate tourism products, it is necessary for each country to know the resources it has, so it can develop strategies to maximize them and achieve greater efficiency in their use, as well as identifying areas of opportunity to develop, or purchase them if necessary.
The land area of Mexico is 1,964,375 km2 of which 1,959,248 km2 are continental surface and 5,127 km2 correspond to insular surface. Mexico stands out among several countries in the world by the extent of its coastline, which is 11,122 km, exclusively on its mainland, excluding island coastlines (INEGI, 2015).
Mexico has two borders (INEGI, 2015):
a. Northern border with the United States. A boundary line extends along 3,152 km from the Monument 258 northwest of Tijuana to the mouth of the Rio Grande in the Gulf of Mexico. The North bordering states are: Baja California, Sonora, Chihuahua, Coahuila, Nuevo Leon and Tamaulipas.
b. Southern Border: The border with Guatemala has an area of 956 km; Belize 193 km (not including 85,266 km of maritime boundary in the Bay of Chetumal). The South and Southeast bordering states in the country are Chiapas, Tabasco, Campeche and Quintana Roo.
Currently the Mexican government is working through its various departments to promote tourism development in the country and improve its ranking among the most popular international destinations.Because of this, the government has implemented various strategies such as the development of new tourism products, regional programs, the creation of the National Training System for Tourism Sector, migration facility measures, opening visas and supporting programs for tourism enterprises.
Within the various tourism products that Mexico has highlighted are:
The “Mundo Maya”(Mayan World), a Mexican region comprising an area of 241.784 km2 covering part of the states of Campeche, Chiapas, Quintana Roo, Tabasco and Yucatan,that offer sun and beach culture, ecotourism and adventure, diving, cruises, business and conventions (SECTUR, 2015).
“Pueblos Mágicos”, localities that have symbolic attributes, legends, history, important events in order to emanate magic in each of its socio-cultural manifestations. Theyrepresent a great opportunity for tourism development in the 31 states states in Mexico. Nonetheless, only 25 states in Mexico have populations that hold the title “Pueblo Mágico”.The entity that has the largest number of Magical Towns is Michoacan (8), followed by Puebla (7), Zacatecas, Jalisco, Guanajuato, and the State of Mexico (5), then Coahuila, Queretaro and Hidalgo(4), Sinaloa,Veracruz and Chiapas (3), Baja California Sur, Sonora, Chihuahua, Tamaulipas, San Luis Potosí, Aguascalientes, Morelos and Yucatan (2), and finally Baja California, Durango, Nuevo León, Nayarit, Colima, Guerrero, Tlaxcala, Oaxaca, Campeche, Yucatan and Quintana Roo (1 magical town each). There is also a Project called “Routes of Mexico” thats has 11 tours that include the 32 states of Mexico and passes over several interesting sites that offer different experiences as: food, ecotourism, adventure, extreme sports, folk art, sun and beach and other attractions and activities to offer visitors to experience the natural, architectural, historical and cultural wealth (SECTUR, 2015).
4. Material and Methods: cluster analysis
Exploratory procedures are often useful in understanding the complex nature of multivariate relationships. Data search to find a structure of “natural” clusters is an important exploratory technique to easily identify outliers and generate interesting hypotheses about the relationship between the variables (JOHNSON & WICHERN, 2007). A cluster is defined as a relatively homogeneous group of observations or cases (BURNS & ROBERT, 2008).
The difference between a successful cluster from other kinds of tourism organizations the integration of a competitive strategy based in satisfying customers demands (LUCIANO, ÁLVAREZ, & CASTROMAN, 2002). In this sense is important to consider that clusters are formed according the similarities and dissimilarities between the analyzed countries. Therefore tourism professionals and researchers should consider that the identity and consciousness of the people that lives in a region can influence in the external image of a cluster, for example, in the resources management, promoting innovation, establishing relationships with external agents and specially the strategies for attracting tourists (ANTUNES & ANTONIO, 2015).
Cluster analysis begins with an extensive amount of data and it is useful to classify the information into groups to facilitate its handling and analysis. In this analysis, there is no prior knowledge about which items belong to which groups.
The group or groups are defined through an analysis of the data. Then the groups can be used to perform multivariate analysis. Unlike others, such as discriminant analysis, cluster analysis creates new groups without any preconceived notion of groups that may arise. Thus, each group is described based on the collected data. In some cases the elements of each group are similar in some ways or very different from other groups. Additionally, cluster analysis is defined as the statistical method for dividing a sample into homogeneous classes to generate an operational classification (BURNS & ROBERT, 2008).
The analysis start considering 20 of APEC countries and their data. Then cluster analysis will be performed to get the clusters based on the similarities and dissimilarities that exists between them.
There are currently several tools and Statistics software to work onthe analysis of clusters. The analysis for this study was performed in SPSS 20.0.0 software.
Since the number of clusters to work with is unknown at the beginning, the analysis technique begins with a sequence of two steps (BURNS & ROBERT, 2008):
Hierarchical Analysis: Using SPSS software first the “Ward” method is selected, using the squared Euclidean distance. This procedure is used to determine the optimal number of groups they will be working with.
Rerun the hierarchical analysis with a number of groups, which makes possible to assign all the cases in the sample to a certain group.
The hierarchical cluster analysis starts with the conglomerate dataand considers each one of them as a cluster, so there are as many cases as groups. Subsequently, using an algorithm the SPSS sequentially combines the groups, reducing them until onlyone group remains. During this process the program calculates the distance between the data points to form differences or groups.
The results are reflected in a dendrogram representing the groups and the distance between them as shown in the following example (UNIVERSIDAD DE VALENCIA, 2014):
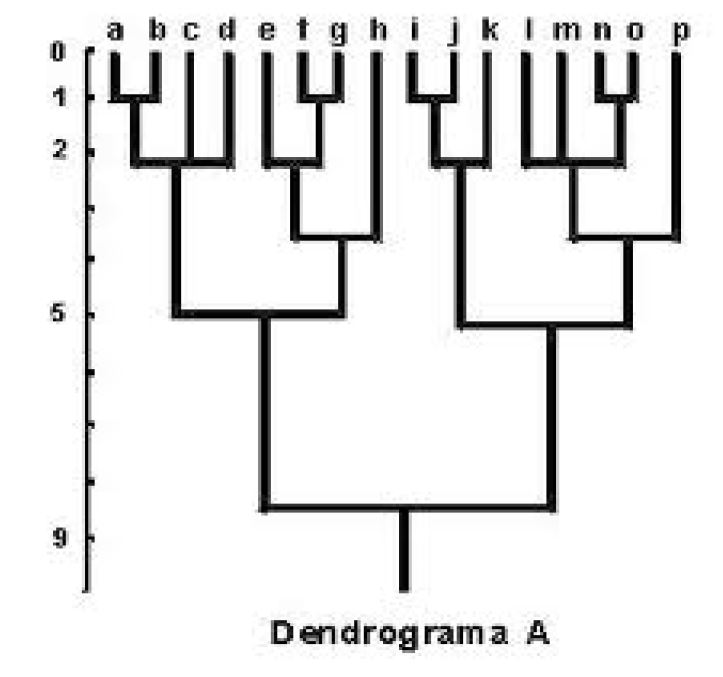
The above graph is called dendrogram and it represents the group formation process as a logical tree. Similarly, it also indicates the distance where the binding has occurred.
In this example the letters represent variables that have been grouped into clusters and on the left side the numbers indicate the distance between each one of them. Therefore, based on the image, it can be said that there are two large clusters in this example: the first one consisting of the letters (a, b, c, d, e, f, g and h) and the second one (i, j, k, l, m, n, p).
The purpose of using SPSS for cluster analysis is to access the program algorithm, which attaches objects to form a large group by measuring the distance between them or their similarities (BURNS & ROBERT, 2008).
To measure the distances there are several methods, in this case the squared Euclidean distance the most accepted one- was used. For this purpose, it must be considered an extension of the Pythagorean Theorem. The distance is usually calculated from raw data rather than standardized.
Once decided how the distances between clusters are to be measured, it is necessary to choose the crowding algorithm to be used. In this study, two algorithms were used:
In this method the approach focuses on the analysis of variance to evaluate the distance between the clusters. This method is based on calculating the sum of squared deviations about the mean cluster (BURNS & ROBERT, 2008).
The Ward approach arises from the loss of information that occurs when integrating different individuals in clusters and to correct this loss, it proposes to measure the sum of the squares of the deviations of each point (individually) and the mean cluster in which it is integrated. A research carried out by Kuiper and Fisher proved that this method was able to better ascertain the optimal classification than other centroid methods -minimum, maximum, mean and (UNIVERSIDAD DE VALENCIA, 2013).
Unlike the hierarchical crowding or Ward method, this one is used when the number of clusters to work with is unknown; this method is used when there is a hypothesis on the number of groups the analysis will be performed with. This way, the number of clusters has to be entered in the software and the K-Means algorithm will result in the desired number of groups containing the most similar elements among each other. Thus, the algorithm will divide the assembly into “k” groups wherein each observation corresponds to the nearest average group (BURNS & ROBERT, 2008).
One of the great challenges that a researcher faces when making use of cluster analysis is to determine the number of groups he will be working with. Although the statistical programs make this determination easier; eventually the factors that will determine the exact number of clusters will be the jugdment of the investigator and the target of the research.
5. Results
Using the SPSS 20.0.0 program, the scores obtained by each of the 20 APEC countries were introduced to each of the 14 variables that determine the competitiveness of tourism according to the World Economic Forum.
Based on this information, the analysis was performed as described below.
Hierarchical Analysis:
As a starting point, similarities or differences in the APEC countries in tourism competitiveness were unknown, so the scores each contry obtained in the tourism competitiveness report of the WEF in 2013 were introduced in the SPSS program in order to obtain the number of clusters with which they would be working.
First the dendrogram was interpreted.The figure that resulted from the hierarchical cluster analysis graphically explains how agglomeration of the 20 APEC countries is conducted according to the scores they obtained in the Travel Tourism Competitiveness report 2013.
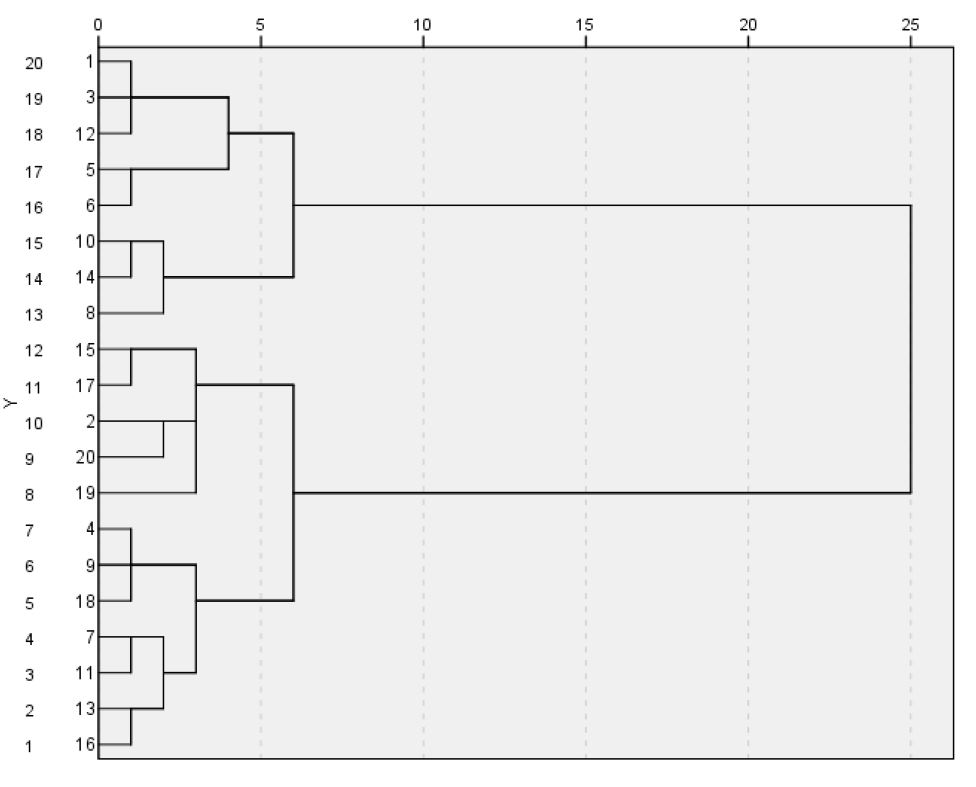
The first column with consecutive numbering from 1 to 20 indicates the number of countries, while the numbers on the right column represent the 20 APEC countries:
| 1. Australia | 11. Thailand |
| 2. Brunei Darussalam | 12. United States |
| 3. Canada | 13. China |
| 4. Indonesia | 14. Hong Kong |
| 5. Japan | 15. Taiwan |
| 6. South Korea | 16. Mexico |
| 7. Malaysia | 17. Chile |
| 8. New Zealand | 18. Peru |
| 9. The Philippines | 19. Rusia |
| 10. Singapore | 20. Vietnam |
At the top, the numbers indicate the distance between groups to show how much they are similar or different. Based on the dendrogram, it can be observed that there are basically four groups or clusters, represented by the horizontal lines, beyond line number 5. Therefore, the dendrogram suggested a solution of 4 clusters to perform subsequent analyzes.
K- Means Analysis:
Once the hierarchical cluster analysis was performed, based on the results shown in the dendrogram, four clusters were selected to work with. The clusters are presented below:
Table 1 The APEC countries organized in 4 clusters.
| Amount of countries | Cluster 1 | Cluster 2 | Cluster 3 | Cluster 4 |
|---|---|---|---|---|
| 1. | Japan | Brunei Darussalam | Australia | Indonesia |
| 2. | South Korea | The Philippines | Canada | Malaysia |
| 3. | United Sates | Chile | New Zealand | Thailand |
| 4. | Taiwan | Vietnam | Singapore | China |
| 5. | Hong Kong | Mexico | ||
| 6. | Peru | |||
| 7. | Rusia |
Source: own elaboration.
As shown in the table, the largest cluster is number 4 with 7 countries: Indonesia, Malaysia, Thailand, China, Mexico, Peru and Russia. The second largest cluster is number 3with 5 countries: Australia, Canada, New Zealand, Singapore and Hong Kong. Finally, cluster 1: Japan, Korea, USA and Taiwan and cluster 2: Brunei Darussalam, Chile and Vietnam with4 countries each.
It should be emphasized that each of the countries within different clusters forms a group of competitors.
In order to determine the characteristics of each cluster, the scores obtained in each of the 14 variables of the study were analyzed.
5. 2 Analysis and description of the clusters
Cluster 1
The first cluster comprises four countries and according to the data provided in 2013 by the World Travel & Tourism Council (WTTC) they had the following development of its tourism industry:
Table 2 Tourism industry data from cluster 1.
| Country | Total contribution to GDP (%of the GDP) | Tourism contribution to employment (%) | Total investment on tourism (%) |
|---|---|---|---|
| Japan | 6.7% | 7.0% | 2.9% |
| South Korea | 5.9% | 6.4% | 2.2% |
| United States | 8.6% | 10% | 6.4% |
| Taiwan | 5.1% | 5.6% | 5.3% |
Source. WTTC, (2013).
In this cluster, the tourism industry represents an important income for the development of its economy, besides being an important generator of jobs. However, except for the United States and Taiwan, which have a tourism-based economy, the total investment in this industry has not been significant.
Cluster 2
The second cluster is also made up of four countries according to the WTTC (2013) and it had the following performance shown in this table:
Table 3 Tourism industry data from cluster 2.
| Country | Total contribution to GDP (%of the GDP) | Tourism contribution to employment (%) | Total investment on tourism (%) |
|---|---|---|---|
| Brunei Darussalam | 5.8% | 6.8% | 16.5% |
| Philippines | 7.0% | 7.7% | 3.1% |
| Chile | 8.3% | 7.9% | 8.4% |
| Vietnam | 9.4% | 8.1% | 8.3% |
Source. WTTC, (2013).
Based on the information shown in the box above, a strong dependence of the countries in the second cluster for the tourism industry stands out. This represents an important income and it is one of the main drivers of their development, which is reflected in the number of jobs generated by the industry in these countries.
In this cluster, the country that invests more in tourism is Brunei Darussalam, followed by Chile and Vietnam, whichmakealmost the same investment. A comparison of these cluster peers, Philippines makes a minimal investment. It obtained almost the same results as others, however.
Cluster 3
The third cluster is formed byfive of the most powerful countries around the world, which are popular for their quality of lifeand the new attractions they havecreated to allure a greater number of tourists.
Table 4 Tourism industry data from cluster 3.
| Country | Total contribution to GDP (%of the GDP) | Tourism contribution to employment (%) | Total investment on tourism (%) |
|---|---|---|---|
| Australia | 9.8% | 12% | 5.7% |
| Canada | 4.4% | 5.3% | 2.3% |
| New Zeland | 14.9% | 19.1% | 8.6% |
| Singapore | 11.3% | 9.1% | 20% |
| Hong Kong | 18.5% | 16.2% | 9.0% |
Source. WTTC, (2013).
According to the provided information, the third cluster has a strong tourist activity and in some cases as Hong Kong or New Zealand, tourism is a major income for their economies. Furthermore, this industry is a major generator of jobs. Finally, it may be seen that countries like Singapore, heavily invest in this industry, meaning that they greatly benefit from it.
Cluster 4
The fourth cluster is the largest. It consists of 7 countries, whose economies may seem more dissimilar, at first glance.
Table 5 Tourism industry data from cluster 4.
| Country | Total contribution to GDP (%of the GDP) | Tourism contribution to employment (%) | Total investment on tourism (%) |
|---|---|---|---|
| Indonesia | 8.9% | 8.0% | 5.2% |
| Malaysia | 15.6% | 13.6% | 7.7% |
| Thailand | 16.7% | 12.4% | 6.8% |
| China | 9.3% | 8.3% | 2.8% |
| Mexico | 12.5% | 13.9% | 7.1% |
| Peru | 8.9% | 7.4% | 4.8% |
| Rusia | 5.9% | 5.5% | 2.7% |
Source. WTTC, (2013).
According to the information above, cluster four has a marked dependence on the tourism industry as one of its main sources of income. The same result is reflected in job creation where undeniebly, tourism plays a key role.
Moreover, investments made by the countries of the fourth cluster in its tourism industry are remarkable, apart from cases of China and Russia, others invest more than 5% in this industry, demonstrating its importance.
Once the four clusters and their performance in the tourism industry were identified over 2013, we can understand more easily the results obtained by each of them in the analysis of K-Means.
The following table shows the centers of the analyzed variables. They are grouped into 20 countries and reflect the attributes of each of the four clusters.
Table 6 Final centers of the clusters.
| Competitiveness factors | Cluster 1 | Cluster 2 | Cluster 3 | Cluster 4 |
|---|---|---|---|---|
| Policy rules and regulations | 5.05 | 4.55 | 5.58 | 4.46 |
| Environmental regulation | 4.45 | 4.03 | 4.82 | 4.17 |
| Safety and security | 5.43 | 5.05 | 6.06 | 4.26 |
| Health and hygiene | 5.95 | 4.45 | 5.70 | 4.44 |
| Prioritization of Travel & Tourism | 4.70 | 4.25 | 5.40 | 4.70 |
| Air transport infrastructure | 4.70 | 3.28 | 5.66 | 3.99 |
| Ground transport infrastructure | 5.58 | 3.48 | 5.26 | 3.60 |
| Tourism infrastructure | 4.83 | 3.22 | 5.38 | 3.87 |
| ICT infrastructure | 5.43 | 3.13 | 5.24 | 3.10 |
| Price competitiveness in the T&T industry | 4.30 | 5.15 | 4.16 | 4.89 |
| Human resources | 5.40 | 4.95 | 5.70 | 4.97 |
| Affinity for Travel & Tourism | 4.65 | 4.60 | 5.40 | 4.54 |
| Natural resources | 4.38 | 3.80 | 4.56 | 5.17 |
| Cultural resources | 5.45 | 2.73 | 4.10 | 4.06 |
Source: Prepared by the authors according to the analysis results on SPSS 20.0
Based on the results shown in the table, Cluster 3 obtained the highest score in the following factors: “Policy rules and regulations”, “Environmental regulation”, the “Safety and security “, “Prioritization of Travel & Tourism”, the “Air transport infrastructure”, the “Tourism infrastructure”,”Human resources”and “Affinity for Travel & Tourism”, were identified as successful competitive factors in these countries.
On the other hand, Cluster 1 markedly differs in emphasizing that “Health and hygiene”,”Ground transport infrastructure”, ” ICT infrastructure ” and “Cultural resources” were the most successful and competitive factors. Meanwhile the Cluster 4, where Mexico is included, only highlighted the “Natural resources” as a competitive factor.
Finally, the Cluster 2 only excelled in the variable “Price competitiveness in the T&T industry”, which is one of the most important variables when talking about competitiveness because it relies on the quality and price of the products and services.
This analysis highlights the significant participation of the Cluster 3, whichexcels more than half of the study variables. However, these results show the picture of the current situation of the tourism industry in APEC and reflect how different factors are affecting the activity of this industry according to each one of the clusters.
Under the competitiveness concept, the price variable is one of the main components and it was the only standing outfactor in Cluster2. On the other hand, Cluster 4 highlights exclusively on natural resources factor. This reflects a clear trend based on its tourism and how this factor becomes its engine.
The following table presents a compilation of which clusters stand out in each of the variables according to the WEF, showing the measurement of competitiveness in the tourism industry in relation to the results obtained in the analysis of K-Means:
Table 7 Competitiveness by cluster according to the study variables.
| Tourism competitiveness variables | Best cluster | Score | Countries | |
|---|---|---|---|---|
| 1. | Policy rules and regulations | 3 | 5.58 | Australia, Canada, New Zealand, Singapore and Hong Kong. |
| 2. | Environmental regulation | 3 | 4.82 | Australia, Canada, New Zealand, Singapore and Hong Kong. |
| 3. | Safety and security | 3 | 6.06 | Australia, Canada, New Zealand, Singapore and Hong Kong. |
| 4. | Health and hygiene | 1 | 5.95 | Japan, South Korea, United States and Taiwan. |
| 5. | Prioritization of Travel & Tourism | 3 | 5.40 | Australia, Canada, New Zealand, Singapore and Hong Kong. |
| 6. | Air transport infrastructure | 3 | 5.66 | Australia, Canada, New Zealand, Singapore and Hong Kong. |
| 7. | Ground transport infrastructure | 1 | 5.58 | Japan, South Korea, United States and Taiwan. |
| 8. | Tourism infrastructure | 3 | 5.38 | Australia, Canada, New Zealand, Singapore and Hong Kong. |
| 9. | ICT infrastructure | 1 | 5.43 | Japan, South Korea, United States and Taiwan. |
| 10. | Price competitiveness in the T&T industry | 2 | 5.15 | Brunei Darussalam, Philippines, Chile and Vietnam |
| 11. | Human resources | 3 | 5.70 | Australia, Canada, New Zealand, Singapore and Hong Kong. |
| 12. | Affinity for Travel & Tourism | 3 | 5.40 | Australia, Canada, New Zealand, Singapore and Hong Kong. |
| 13. | Natural resources | 4 | 5.17 | Indonesia, Malaysia, Thailand, China, Mexico, Peru and Russia |
| 14. | Cultural resources | 1 | 5.45 | Japan, South Korea, United States and Taiwan. |
Source: Prepared by the authors according to the K-Means analysis results on SPSS 20.0
Consequently, based on the results presented above, it can be said that Cluster number 3 is the most competitive in APEC. However, the result of Cluster 2should be stressed, since itsurprisingly is the most competitive in the variable “Price Competitiveness in the Tourism Industry”.
It may be said that Cluster 1 is the second most competitive in the tourism industry within APEC, which coincidentally match up developed countries that attract hundreds of tourists: both business and pleasure.
Finally, Cluster 4 -the largest- is the least competitive within APEC because it only outstands in the variable of “Natural Resources”. This means that countries in this cluster need to explore their opportinity areas and generate strategies that allow them to leverage their resources and invest in other areas to develop and strengthen their tourism industry. Unfortunately, Mexico is within the less competitive cluster in the Asia-Pacific region.
6. Conclusions
In terms of APEC tourism competitiveness, the study concludes that the cluster number 3 is the most successful of them, with the highest scores in most of the analyzed factors, including the factors of greatest impact on tourism. Therefore, according to the analyzed data, Australia, Canada, New Zealand, Singapore and Hong Kong are the most competitive countries in the tourism industry in the region, followed by Japan, South Korea, the United States and Taiwan.
Meanwhile Brunei Darussalam, Chile and Vietnam, appear to becompetitive in the APEC tourism industry, exclusively under the “price” variable. Their future in tourism is uncertain, because their strategy depends on a variable that is constantly changing.
Nowadayssuch variable represents their greatest strength and helps them attract a certain volume of tourists, but tomorrow it could be severely affected and these countries will lose the income they get out of this activity. Therefore, it is advisablethat members of this cluster diversify their strategies to attract tourists and ensure their permanence within the industry.
Finally we have the rest of the APEC countries: Indonesia, Malaysia, Thailand, China, Mexico, Peru and Russia, which have proved to be the least competitive in tourism, because they only highlight in the “natural resources” factor.
Based on the results, Mexico belongs to the least competitive countries in the region. However, this result provides a starting point for generating strategies that enable the country to modify its performance in this industry. Due to its rich biodiversity, natural resources may be seen as strength for Mexico, since they have not yet been fully exploited as tourist attractions, except for only certain zones.
In the case of Mexico the importance of the tourism industry is remarkable:it is one of the main sources of income for the country, it contributes to its national development through the creation of direct and indirect jobs, and it enables the use of complementary services.
Mexico needs to align objectives between the government and the private sector to achieve comprehensive development in the competitive factors in its cluster: tourism and air infrastructure. Likewise, it should do the same with the main factors of APEC tourism competitiveness: cultural resources and environmental sustainability.
If Mexico improves its airport status and invests in the development and creation of tourist destinations, if it works on its preservation and exploit its cultural wealth, it could be possible to assume that its tourism competitiveness in Asia-Pacific would significantly improve and quite possibly it will become one of the most demanded destinations, achieving a leadership position in the region.
To have a clearer picture about it, further research should be done to know what kind of tourists are visiting Mexico, what their expectations are and the factors that ultimately affect their decision to choose it as a destination instead of another country. Additionally, specific informationought to be collected: nationality, income, marital status, education and other important data to serve as a basis for generating positioning and advertising strategies and as wellfor focusing on the development of an infrastructure that meets the expectations of the international tourists.
