


 texto em
  Inglês (pdf)
 Artigo em XML
 Referências do artigo
 Enviar este artigo por email
 Citado por SciELO
  Similares em
SciELO
Similares em
SciELO 
 Permalink
1 INTRODUCTION
The strong growth of tourism over the last decades has led to its adoption as a strategy to achieve economic development (Ribeiro, Lopes, Montenegro, & Andrade, 2017a; Ribeiro, Silva, Andrade, & Souza, 2017b). According to the World Travel and Tourism Council (WTTC, 2016), one in every 11 jobs generated worldwide in 2015 was related to tourism activity. Also, in that same year, tourism represented 9.8% of global GDP. Considering that tourism has direct and indirect relationships with other sectors, the income generated circulates through the economy, thus enhancing the revenue stream of the host destination.
Tourism in Brazil, in 2016, generated R$530.5 billion considering direct, indirect, and induced activities. It is estimated that in 2027 tourism will account for 9.1% of the Brazilian GDP (Tomé, 2017). Despite the economic relevance of the industry, there are still significant deficiencies in the production and dissemination of statistical information on tourism in Brazil such as the lack of a Satellite Account.
Notwithstanding, the recent effort by public authorities to develop new statistical information, namely data on informal tourism-related activities, must be recognized. According to information from the Institute for Applied Economic Research (IPEA, 2015), in 2013, the number of activities characteristic of tourism (ACTs) in Brazil was approximately 1,938 million, of which 51% corresponded to the formal labor market and 49% to informal jobs. It is worth mentioning that between 2012 and 2014 the percentage of informal tourism employment was reduced in the Brazilian regions (see Appendix 1A and 1B). Among the sectors that make up the ACTs, Culture and Leisure had the highest percentage of informality in 2014 (64%), followed by Food Services (57%). On the other hand, Air Transportation had the lowest percentage, an average of 5.3% in the analyzed period. Therefore, the degree of formality varies depending on the ACTs examined.
In order to analyze the Brazilian tourism industry from the supply point of view, this study aims to verify if the tourism sector, at the municipal level, is more developed and specialized in the richest regions of the country, the South and Southeast. Although the degree of informality in the ACTs is relevant, as discussed earlier, this article considers only the formal labor market due to lack of recent municipal data on informal jobs.
The objective of this article is, thus, to characterize the tourism sector in the 5,565 Brazilian municipalities in the year 2015. This analysis is based on the identification of groups of municipalities according to the number of tourist establishments, average income, educational level, employment, and level of specialization of tourist services. All these data were obtained from the Annual Report on Social Information (RAIS) of the Ministry of Labor and Employment. We used cluster analysis to group the Brazilian municipalities according to the characteristics of their tourist services. This method enables to group pre-established variables into homogeneous groups (Hair Jr, Anderson, Tathan, & Black, 2005).
Cluster analysis is widely used in the literature. We can highlight studies in the field of tourism (Ribeiro & Andrade, 2015; Hurtado & Bonilla, 2012; Moreira Filho, Nascimento, & Segre, 2010; Lins, 2000); cultural sector (Machado, Simões, & Diniz, 2013; Ribeiro & Lopes, 2015), finance (Massardi & Abrantes, 2014), among others.
In addition to this introduction and the final considerations, this article is divided into three more sections. The first section discusses the relationship between tourism, development, and public policy. The second section presents the cluster analysis, the database used and treatment of variables. The third section summarizes the main results and discussion. Lastly, some final considerations are made and the references are listed.
2 TOURISM, DEVELOPMENT, AND PUBLIC POLICY
This section discusses the importance of the tourism industry for local/regional development, i.e., it identifies how this activity can contribute to development and lists some of the positive and negative impacts of tourism.
Tourism creates a multiplier effect by stimulating other economic sectors, which can boost development. This happens because tourists not only consume tourist products at the destination, but also goods and services from other segments. In this way, tourism can have three types of economic impacts: i) direct; which results from the generation of jobs from the activity itself; ii) induced; caused by tourists' expenses; and iii) indirect; which is the multiplier effect on the economy caused by these expenditures (Ribeiro & Lopes, 2015).
In other words, tourism expenditure has multiple effects on the economy as it affects production, employment, income, and government revenue. In addition, the tourist activity can increase residents’ real income.
It should be mentioned that even localities that do not receive tourists can benefit from income and employment spillovers. It suffices that these regions are suppliers of products demanded by tourists, such as craft and agricultural products. Thus, the effects of tourism exceed the limits of the destination, since neighboring localities can also be affected (Barbosa, 2005). In this regard, Lazzaretti and Capone’s (2009) study in Italy found that the growth of tourism employment in neighboring municipalities increases local employment in the same activity. Conversely, Ribeiro et al. (2017a) verified the opposite effect in Brazil, i.e., the increase in tourist employment in neighboring municipalities reduces employment in the same sector locally.
Tourism leads to redistribution of income, i.e., a monetary flow occurs from several regions (origin) to the tourist destination. When it has a low level of development, it can use its tourism potential, be it natural or cultural, as a mechanism to attract investments and generate jobs (Ablas, 1991). In addition, some studies have shown the impact of tourism on inequality. Haddad, Porsse, and Rabahy (2013) and Ribeiro et al. (2017b), for example, argue that tourism in Brazil contributes to the reduction of regional inequalities.
Anato (2006) emphasizes the role of the Internet in the development of tourism. This network has allowed the emergence of numerous online travel agencies, enabling consumers to access information on destinations more quickly and easily.
On the other hand, Tourism can also have some negative impacts. These include: (i) increased prices at the destination as a result of the intense consumption of tourists; ii) dependence on tourism; it is not recommended that developing countries use tourism as the main development policy, as the tourism demand is also subject to external influences; and (iii) cultural and environmental impacts; the development of tourism activities can lead to the degradation of environmental and cultural resources of the receiving community (Lage & Milone, 1991).
As far as tourism policies in Brazil are concerned, the creation of the Ministry of Tourism (MUR), in 2003, reflected the concerns of the Brazilian government in adopting measures to promote the development of this industry in the country. The Tourism Regionalization Program (PRT) is the most recent public policy in this segment, which aims to develop tourism through the participation of residents in order to enhance tourism in a particular region (Brasil, 2007).
In addition to the PRT and other laws and projects focusing on tourism, one of the main programs currently in place is PRODETUR National, which aims to strengthen Brazilian tourism policy. This program provides investments in five components: i) Tourist Product; ii) Tourism marketing; iii) Institutional strengthening; iv) Infrastructure and basic services; and v) Environmental management (Ribeiro, Andrade & Pereira, 2013).
3 CLUSTER ANALYSIS, DATABASE, AND TREATMENT OF VARIABLES
3.1 Cluster analysis
The literature presents several definitions of cluster. The most well-known concept, however, was the one proposed by Porter (1998), who defined cluster from a geographical perspective, that is, a geographic concentration of companies belonging to the same sector or related to activities that act in a complementary way. It is worth mentioning that this author has analyzed the formation of clusters in the industrial sector.
This concept, however, has been adapted to the tourism industry. A tourism cluster, according to Lins (2000), can be defined as the set of stakeholders encompassing tourist companies, public authorities and private bodies that operate through coordination, training of human resources, and planning of the sector.
In keeping with Moreira Filho et al. (2010) a cluster encompasses specific features of a region and can be characterized as horizontal, that is, when it is composed of companies that belong to the same sector; or vertical, if it includes companies that act in a complementary way at different levels of the productive chain.
As with concepts, the literature refers to different methods for identifying clusters. Hurtado and Bonilla (2012), using the latent class method, classified the tourist regions of Spain according to supply and demand. The authors used this method as an alternative to cluster analysis, because it is less random for determining the number of groups to be formed.
Moreira Filho et al. (2010) have analyzed the formation of a tourism cluster in the district of Santa Tereza in Rio de Janeiro4 and its impact on local development from the perspective of local social actors, i.e., residents, entrepreneurs, and representatives of the community. In the same vein, Lins (2000) has investigated the formation of a tourism cluster in the region of Florianópolis from the interrelationships between local authors.
A common aspect among all these approaches is the geographic factor, that is, a cluster is understood as a delimited grouping within a space. However, the cluster definition adopted in this article is that of the statistical method that considers the similarities between the variables of the groups and disregards the geographic factor. In other words, it is possible to have two Brazilian municipalities from different regions in the same group. The works by Ribeiro and Andrade (2015), Ribeiro and Lopes (2015), and Massardi and Abrantes (2014) are examples of research applying this technique.
The study by Ribeiro and Andrade (2015) analyzed the tourism services in the Brazilian mesoregions, where income was the variable that most differentiated the groups. Ribeiro and Lopes (2015), in turn, verified that the highest incomes of the cultural sector are in Rio de Janeiro and in São Paulo, municipalities composed of individual clusters. Along the same lines, Massardi and Abrantes (2014) found that most municipalities in Minas Gerais depend on the Municipal Participation Fund (FPM).
Cluster or grouping analysis is a procedure that groups the observations according to their original structure. However, unlike other multivariate techniques, the variables are pre-established and not estimated empirically (Fávero, Belfiore, Silva & Chan, 2009). In keeping with Linden (2009), cluster analysis is a computational technique that seeks to organize observations into groups according to similar characteristics. The groups formed must be internally homogeneous and externally heterogeneous.
The purpose of this statistical technique is to group variables that have similar characteristics, thus, it is necessary to adopt some measure of distance. In fact, the closest observations are the most similar and, therefore, they belong to the same grouping (Fávero et al., 2009). In this study, the Euclidean distance was used, in which the distance between the observations (i and j) is the sum of the squares of the differences between i and j for all p variables, that is:
Being:
All variables were standardized to eliminate possible scaling problems. In addition, two clustering methods were used in a complementary way: hierarchical and non-hierarchical methods. The first defines the number of groups to be formed. Once the number of groups was defined by the first method, the non-hierarchical method was applied.
The number of clusters in the hierarchical method was defined using the Ward’s method, since it is the most appropriate when using Euclidean distance (Hair et al., 2005; Fávero et al., 2009). As per Malhotra (2006, p. 578), this method is one of the most used and seeks to "minimize the square of the Euclidean distance to the means of the clusters".
3.2 Database and treatment of variables
The Brazilian municipalities weregrouped according to the similarities of the tourism activities using the following variables, collected at municipal level for the year 2015: i) number of tourist establishments per 100,000 inhabitants; ii) number of tourism-related jobs in relation to the total employment; iii) average income from tourism activities; iv) percentage of workers in tourism-related activities with higher education; and v) Tourism Location Quotient (QL in the Portuguese acronym).
QL compares the share of a region j in a sector i with the participation of that region j in the total employment of all regions (Haddad, 1989). This work considers the participation of tourism employment in the total employment of Brazilian municipalities in comparison to the share of tourism employment in total employment in Brazil, that is:
Where:
E ij : tourism employment in the municipality j;
E i. : total employment in the municipality j;
E. j : tourism employment in Brazil (reference region);
E .. : total employment in Brazil.
QL measures the degree of tourism specialization in each Brazilian municipality. If QL> 1 the municipality is considered specialized in the tourism sector in relation to the reference region. Several works in the literature have used QL as a proxy for specialization externalities (Glaeser, Kallal, Scheein-kman, & Shleifer, 1992; Combes, 2000; Aulicino, 2011; Ribeiro et al., 2014; Ribeiro et al., 2017a).
The data used were obtained from RAIS, which do not include informal jobs. The only and most recent database that provides formal and informal data in relation to the municipal labor market is the Demographic Census of 2010 and, therefore, they would not portray the current Brazilian reality. Data scarcity or lag cannot be an obstacle to the development of tourism studies. In fact, RAIS data have been widely used in the literature (Garsou, Corderi, Velasco, & Colombo, 2017; Ribeiro et al., 2017a; Ribeiro & Andrade, 2015; Ribeiro & Lopes, 2015).
For the construction of the database, the "Class" sector level of the Brazilian Code of Economic Activities 2.0 (CNAE 2.0) was used, which provides more disaggregated information on the activities. The classification we used to identify tourist services was proposed by Ribeiro and Andrade (2015), in which the tourism sector is composed of 25 economic activities, as shown in Table 1.
Table 1 Touristic services in Brazil
| Class CNAE 2.0 Classification |
|---|
| Subway and rail passenger transportation |
| Public road transportation of passengers, with fixed itinerary, in municipal and metropolitan region |
| Public road transportation of passengers, with fixed itinerary, inter-municipal, inter-state and international |
| Road transportation by taxi |
| Public passenger road transportation, under charter regime, and other kinds of road transportations |
| Tourist trains, cable cars and the like |
| Cabotage transportation |
| Passenger transportation by inland navigation in regular lines. |
| Regular air transportation of passengers |
| Non-regular air transportation of passengers |
| Hotels and the like |
| Other kinds of accommodation not previously specified |
| Restaurants and other food and beverage service establishments |
| Itinerant food services |
| Catering, buffet and other ready-made food services |
| Car rental without a driver |
| Rental of other kinds of transport, except cars, without a driver |
| Recreational and sport equipment rental |
| Travel agencies |
| Travel operators |
| Booking and other kinds of touristic services not previously specified |
| Museum and exploration activities, artistic restoration and conservation of historical places and buildings, and similar attractions |
| Botanical garden activities, zoos, national parks, ecological reserves and environmental preservation areas. |
| Amusement parks and theme parks |
| Recreation and leisure activities not previously specified |
Source: Ribeiro and Andrade (2015)
The mentioned authors, in the absence of a Satellite Account, draw on research on Tourism Economics conducted by the Brazilian Institute of Geography and Statistics (IBGE). In summary, this study considers the following activities pertaining to tourism: i) Accommodation services; ii) Food and beverages serving services; iii) Passenger transportation services; iv) Travel agency, tour operator and tourist guide services; v) Cultural services; vi) Recreational and other entertainment services; and vii) Miscellaneous tourist services.
4 RESULTS AND DISCUSSION
Table 2 presents descriptive statistics for the five variables that were used in the cluster analysis thus allowing for an exploratory analysis of the database. It should be noted that the database is made up of 5,565 observations (Brazilian municipalities).
Table 2 Descriptive statistics
| Variables | Average | Standard deviation | Minimum | Maximum |
|---|---|---|---|---|
| QL | 0.41 | 0.65 | 0.00 | 11.93 |
| Est_h | 99.17 | 141.37 | 0.00 | 4.881 |
| Renda | 190.35 | 248.90 | 0.00 | 3,360.43 |
| Edu | 0.17 | 0.09 | 0.00 | 0.97 |
| E_t | 0.03 | 0.04 | 0.00 | 0.74 |
Source: Authors own elaboration
In general, all variables depict a relatively strong degree of data heterogeneity since the respective standard deviations are high. The share of tourism employment in relation to the total (E_t) and the number of tourist establishments per 100,000 inhabitants (Est_h), for example, ranges from 0% to 74% and 0 to 4,481, respectively. The average income in the tourism sector among Brazilian municipalities in 2015 was only R$190.35. In addition, 17% of the labor force, on average, have completed higher education.
The use of the hierarchical method generated the dendrogram shown in Figure 1. From this, a horizontal line (in red) was drawn at the point where a greater branching of the number of groups was observed, in agreement with Fávero et al. (2009). At this point, the number of vertical lines that the red line crosses is the ideal number of clusters, in this case six.
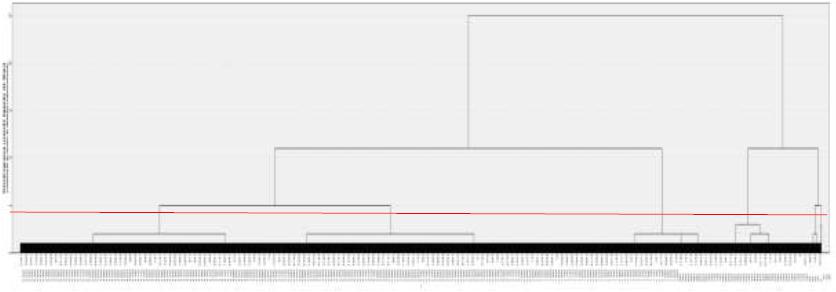
Based on this information, the non-hierarchical method was used by calibrating it with six groups. Table 3 shows the ANOVA statistic, which allows to verify which of the variables used in the present study have the highest weight in cluster formation, i.e., that most differentiated the groups.
Table 3 ANOVA’s Statistic
| Variable | Cluster | Error | F | Sig. | ||
|---|---|---|---|---|---|---|
| Mean Square | df | Mean Square | Df | |||
| QL | 900.86 | 5.00 | .191 | 5,558 | 4,726.84 | <0.001 |
| Est_h | 749.99 | 5.00 | .326 | 5,558 | 2,298.46 | <0.001 |
| Renda | 769.77 | 5.00 | .308 | 5,558 | 2,495.98 | <0.001 |
| Edu | 142.47 | 5.00 | .873 | 5,558 | 163.24 | <0.001 |
| E_t | 899.64 | 5.00 | .192 | 5,558 | 4,693.35 | <0.001 |
Source: Authors own elaboration
ll the variables used were significant since the last column (Sig.) presented values <0.001 for all of them. From the F-statistic it is possible to observe which variable contributed most to the formation of clusters. It can be noticed that the QL presented higher value of the F-statistic and, therefore, it was the one that differentiated more the formation of the groups. It is important to highlight that this variable seeks to identify the Brazilian municipalities that are more specialized in tourism. The results of cluster estimation are summarized in Table 4.
Table 4 Clusters results of Tourist Services
| Variable | Cluster | Number of municiplities | Average | Standard deviation | Minimum | Maximum |
|---|---|---|---|---|---|---|
| Location Quotient of employment in tourism (LQ) | 1 | 17 | 6.34 | 1.69 | 4.31 | 10.22 |
| 2 | 3,230 | 0.12 | 0.14 | 0.00 | 1.14 | |
| 3 | 1,812 | 0.57 | 0.31 | 0.04 | 1.82 | |
| 4 | 139 | 2.68 | 0.92 | 0.14 | 6.7 | |
| 5 | 366 | 1.06 | 0.35 | 0.05 | 1.05 | |
| 6 | 1 | 11.93 | ... | 11.93 | 11.93 | |
| Total | 5,565 | 0.41 | 0.65 | 0.00 | 11.93 | |
| Number of tourist establishments per 100,000 inhabitants (Est_h) | 1 | 17 | 1,277.88 | 643.89 | 397 | 2,837 |
| 2 | 3,230 | 35.5 | 39.5 | 0.00 | 235 | |
| 3 | 1,812 | 155.94 | 88.77 | 6 | 1,295 | |
| 4 | 139 | 292.39 | 220.31 | 19 | 1,288.37 | |
| 5 | 366 | 208.30 | 99.32 | 33 | 1,343 | |
| 6 | 1 | 4,881 | ... | 4,881 | 4,881 | |
| Total | 5,565 | 97.17 | 141.37 | 0.00 | 4,881 | |
| Average income in tourism sector | 1 | 17 | 593.87 | 279.41 | 138.17 | 1,066.93 |
| 2 | 3,230 | 58.90 | 61.75 | 0.00 | 470.89 | |
| 3 | 1,812 | 273.24 | 142.39 | 30.44 | 706.39 | |
| 4 | 139 | 349.53 | 255.30 | 42.85 | 1,288.37 | |
| 5 | 366 | 858.86 | 358.54 | 343.48 | 3,360.43 | |
| 6 | 1 | 777.12 | ... | 777.12 | 777.12 | |
| Total | 5,565 | 190.35 | 248.90 | 0.00 | 3,360.43 | |
| Percentage of formal employees with higher education (Edu) | 1 | 17 | 0.12 | 0.03 | 0.07 | 0.2 |
| 2 | 3,230 | 0.19 | 0.10 | 0.00 | 0.97 | |
| 3 | 1,812 | 0.12 | 0.04 | 0.00 | 0.44 | |
| 4 | 139 | 0.13 | 0.07 | 0.02 | 0.77 | |
| 5 | 366 | 0.15 | 0.05 | 0.06 | 0.4 | |
| 6 | 1 | 0.9 | ... | 0.9 | 0.9 | |
| Total | 5,565 | 0.17 | 0.09 | 0.00 | 0.97 | |
| Number of jobs in the tourism sector (E_t) | 1 | 17 | 0.39 | 0.10 | 0.27 | 0.63 |
| 2 | 3,230 | 0.01 | 0.008 | 0.00 | 0.07 | |
| 3 | 1,812 | 0.03 | 0.02 | 0.00 | 0.11 | |
| 4 | 139 | 0.16 | 0.06 | 0.01 | 0.44 | |
| 5 | 366 | 0.06 | 0.02 | 0.00 | 0.12 | |
| 6 | 1 | 0.74 | ... | 0.74 | 0.74 | |
| Total | 5,565 | 0.02 | 0.04 | 0.00 | 0.74 |
Source: Authors own elaboration
Table 4 shows the main descriptive statistics of the six groupings. Cluster 1 includes 17 cities, in which the ones that stand out have strong tourist appeal, mainly in the sun-and-sea segment, namely: Porto Seguro, BA; Mata de São João, BA; Jijoca de Jericoacoara, CE; Bonito, MS; Alto Paraíso de Goiás, GO; Armação de Búzios, RJ; Paraty, RJ; Ilhabela, SP; and, Gramado, RS. When observing the level of specialization of the tourism activity, it was verified that this group has a high level of specialization (QL=6.34), second only to cluster 6 (QL=11.93). These cities have, on average, 1,277 tourist establishments per 100,000 inhabitants; 39% of the formal labor force are in the tourism sector, 12% of them have completed higher education, and the average salary in the sector is R$593.87. Given the characteristic of this group, it can be considered as a tourism cluster.
Most of the Brazilian municipalities, 3,230 (58%) are included in cluster 2. In general, tourism activities are underdeveloped in these municipalities since, on average, only 1% of formal workers work in the industry with an average salary of R$58.90 and there are only 35.5 tourist establishments per 100,000 inhabitants. In addition, QL was close to zero (0.12), indicating that these municipalities are not specialized in the tourism segment. This result suggests that the great majority of Brazilian municipalities have an underdeveloped labor structure and tourism offer. A similar result was obtained by Ribeiro and Lopes (2015) for the cultural sector, which indicates that this sector does not exist in most Brazilian cities.
Cluster 3 encompasses 1,812 municipalities, together with cluster 1 it presented the lowest percentage of workers in the tourism sector with higher education (12%). There are 155 tourist establishments per 100,000 inhabitants, well below the 1,277 observed in the first cluster. Only 3% of formal workers are employed in tourism-related activities. In addition, the average income of a worker in the tourism sector (R$273.24) is about four times higher than in cluster 2. Like cluster 2, this group presented an underdeveloped structure of the tourism sector.
Cluster 4 was composed of 139 municipalities. According to the results, it could be classified as a cluster specialized in tourism, with an average of QL=2.68. Among the cities that are included in this cluster the following stand out: Barra de São Miguel, AL; Maragogi, AL; São Miguel dos Milagres, AL; Lençois, BA; Vera Cruz, BA; Itacaré, BA; Santa Cruz de Cabralia, BA; Lagoa Santa, GO; Chapada dos Guimarães, MT; Arraial do Cabo, RJ; São Miguel do Gostoso, RN; Balneário Camboriu, SC; Gravatal, SC; and, Santo Antônio do Pinal, SP, municipalities with tourism potential in the sun-and-sea segment, adventure tourism, or cultural tourism. This group had, on average, 292 tourist establishments per 100,000 inhabitants; of the total number of formal workers working in these cities, only 16% are engaged in tourism activities, 13% have completed higher education and the average income was R$349.53.
Although groups 1 and 4 can be considered tourism clusters, they have a very low average income. This may be associated in part with the low qualification of the workforce, since only 12% and 13%, respectively, of the workers in the tourism industry have completed higher education.
Cluster 5 includes 366 cities, among which are all 27 Brazilian capitals. These municipalities have, on average, 208 tourist establishments per 100,000 inhabitants, 6% of the formal workers are in the tourism industry, of which 15% have completed higher education. This group presented the highest average salary in the tourism sector (R$858.86). However, Guimarães and Silva (2013) identified a gender pay gap in this sector, since 67.79% of the highest wages are paid to men. It is noteworthy that the larger the city, the greater the diversification of its economy. Nevertheless, it is to be expected that, although this cluster is not specialized in tourism, the sector presents the highest average remuneration and, relatively, the third higher education level. This is expected due to the higher cost of living in large cities and the strong competitiveness in the labor market.
It stands out that cluster 6 is composed only by Fernando de Noronha, PE, the Brazilian city that was the most specialized in tourism in the year 2015 (QL=11.93). The main statistical reason for this result is the QL value. As highlighted above, this variable was the one that most differentiated the formation of the groups. This result is consistent with those of Ribeiro et al. (2017) that also identified the tourism sector of this municipality as the most specialized in Brazil. It can be observed that 74% of the formal labor force is in the tourism sector, 90% of these workers completed higher education and receive an average salary of R$777.12 (the second-highest income group). Another aspect is that this city represents one of the main tourist attractions of Brazil both for the domestic and international markets. On the other hand, this result should be put in perspective, since Fernando de Noronha is an island whose only economic activity is tourism. Thus, the municipality is dependent on this industry and therefore, as the entire labor market revolves around tourism, it is expected that the municipality is specialized in the sector.
Contrary to the findings in this article, in the works by Machado et al. (2013) and Ribeiro et al. (2014), which examined the creative and leisure industries, respectively, the cities of São Paulo and Rio de Janeiro were grouped in a single cluster. In turn, Ribeiro and Lopes (2015) studied the cultural sector in Brazil and identified that the municipalities of Rio de Janeiro and São Paulo were each in separate clusters, composed only by them.
In general, it can be considered that groups 1, 4, and 6 are tourism clusters, since they have several cities specialized in the sector. In the three groups there are municipalities with strong tourism potential in different segments. However, there was no predominance, in these groups, of municipalities located in the richest regions of Brazil, South and Southeast. On the contrary, when analyzing the tourism market of the Brazilian mesoregions Ribeiro and Andrade (2015) found that the cluster with the best results was the one with the predominance of mesoregions in the South and Southeast. This result is very important because it suggests that tourism can be used as a development strategy in cities located in poorer regions, as already discussed by Ribeiro et al. (2017b).
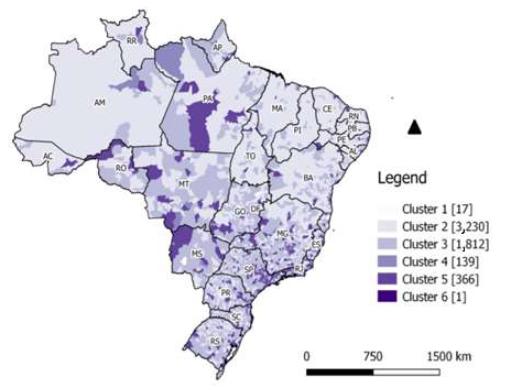
From Figure 2 it is possible to visualize the spatial distribution of the clusters in the Brazilian territory. It is verified that the relatively worse results, among the analyzed variables, are found in clusters 2 and 3, which are mainly composed of municipalities located in the North and Northeast, the poorest regions of Brazil. Therefore, it can be inferred that in 5,042 Brazilian municipalities, representing 90.60% of the total, the formal tourism labor market is underdeveloped. In other words, the most developed and structured tourism offer is concentrated in few municipalities not necessarily in the richest Brazilian regions.
5 FINAL CONSIDERATIONS
This study analyzed the tourism industry in Brazilian municipalities in 2015. For this purpose, cluster analysis was used to group municipalities according to the similarities of their tourism services.
Throughout this study, we have tried to answer the following research question: Is the tourism sector more developed and specialized in the richest regions of the country? From the analysis conducted in this article we can verify that the most specialized cluster in tourism was formed by a single city, Fernando de Noronha, PE, located in the Brazilian Northeast. However, in Fernando de Noronha, PE the predominant economic activity is tourism, so it is expected that this locality presents a high level of specialization of the sector. It cannot be stated that the Brazilian tourism sector is more specialized and developed in the richest regions of the country since group 2 was second only to the cluster formed by Fernando de Noronha, PE and this cluster was not predominantly composed of municipalities in the South and Southeast of the country. Most of the Brazilian municipalities (90.60%) have underdeveloped supply structure and tourist labor force (Figure 2).
In contrast to previous studies analyzing the leisure industry (Ribeiro et al., 2014), the creative industry (Machado et al., 2013), and the cultural sector (Ribeiro and Lopes, 2015), in which the municipalities of São Paulo and Rio de Janeiro stood out in comparison to other Brazilian cities, the results focused specifically on tourism activities highlights the municipality of Fernando de Noronha, PE, not surprisingly since this is one of the main tourist destinations in Brazil .
From the results it is possible to infer that clusters 1, 4, and 6 can be classified as tourism clusters, since in these groupings there is a predominance of cities with strong tourist appeal, in addition to being the groups that presented the highest level of specialization of the sector. However, in general, there is a low qualification of workers in the sector (only 17% on average had higher education). In fact, tourism policies should prioritize the promotion of continuous training of the workforce.
The results indicated that there are several cities in the Northeast, for example, with tourism potential. Thus, tourism can be used in these cities as a development strategy. For this purpose, the sector must be structured, namely the tourism infrastructure, promotion of the destination, among other actions.
The main limitation of this study is the use of formal data, which precludes more specific results according to the actual situation of the Brazilian tourism sector. However, as mentioned previously, there are no current informal data on tourism employment at the municipal level. The latest data are for 2010 which would not reflect the current situation of tourism in Brazil. Faced with such difficulties, we chose to use more recent data, but without considering informal work.
In view of the foregoing and given the power of tourism to enhance directly or indirectly the local/regional development, it is important that authorities implement well-planned policies with the purpose of promoting the harmonious development of the tourism sector maximizing the positive impacts and minimizing its negative effects.
In addition, it is of paramount importance the continuous effort of the public sector to produce new statistical information on the tourism industry in Brazil. In this regard, public-private partnerships can be a good strategy. Future research can continue to build on these lines and contribute to more efficient analysis and guidelines.

