


 texto em
  Inglês (pdf)
 Artigo em XML
 Referências do artigo
 Enviar este artigo por email
 Citado por SciELO
  Similares em
SciELO
Similares em
SciELO 
 Permalink
1 INTRODUCTION
Hotels and resorts can provide fitness facilities and equipment for their guests. These facilities should not be dismissed as an extension of the hotel industry. They can provide a valuable health and wellness benefit for people of all ages and abilities in their daily routine. But before introducing the physical exercise in the hotel facilities, one must evaluate the quality of the service provided.
Quality of service is defined as the totality of characteristics that bear on the ability to satisfy the needs of customers (Said & Fathy, 2015). This ability reflects the value of customer service and it implies that the organization can identify which features are the basis for measurement and control. "Service quality is recognized as a critical success factor in a firm’s endeavors to differentiate itself from its competitors" (Ladhari, 2009, p. 172), differing to increase the profitability in quantity of some attribute or service characteristics, such as the inseparability of production and consumption, intangibility, heterogeneity, and high degree of customer contact (Lovelock & Wright, 1999; Brida, Moreno-Izquierdo & Zapata-Aguirre, 2016).
The service sector has a greater influence on consumers as it expands. Organizations increasingly use marketing campaigns to attract more customers and to arouse their desire for consumption (Kotler & Armstrong, 1996). In this sense, the service organizations themselves contribute to develop in consumers, current and potential, new desires or needs, hitherto untapped.
Due to their peculiarities, services are highly dependent on customers enjoying them. Since they are consumed at the same time as they are produced, customer satisfaction is the "key point" in evaluating service performance (Santos et al., 2017). For these and other reasons, the use of more specific techniques to assess customer perceptions and expectations of service quality, can contribute to a better performance of these organizations.
Together with the application of methods that aim to improve the quality of services, according to Falcão et al. (2017), service organizations should always seek to understand customers, identify what they consider "value", know their needs, and satisfy them in the best possible way, as this type of company depends on customer satisfaction to achieve sustainable competitive advantages.
In this sense, it is important to seek improvements in services and this can be achieved by applying quality tools appropriate for the intended purpose. In keeping with Falcão et al.’s (2017) view customers’ needs change every day and thus, efforts to improve service quality must keep pace with such changes. In addition, consumer expectations are often shaped by subjective aspects of personal judgment that make it difficult to gauge customer satisfaction.
According to Evans and Lindsay (1993, p. 10), the organization must consider the difference between expectations and perception of service such as the five service quality dimensions (Parasuraman et al., 1985; 1988): (1) tangibles (physical facilities, equipment, and appearance of personnel); (2) reliability (ability to perform the promised service accurately); (3) responsiveness (willingness to help and to provide service); (4) assurance (knowledge and courtesy of employees and their ability to inspire confidence); and (5) empathy (individualized attention the firm provides its customers). These dimensions pose different challenges for quality assurance and demand for measurable characteristics that can be evaluated by customers. One method to measure efficiently the service quality is SERVQUAL, it was created by Parasuraman et al. (1985), based on these five dimensions.
This article intends to develop a methodology of service quality management for a hotel fitness center. The technical procedures used for this research are based on the case study model of Yin (2003). The study analyzed the methodology proposed in a hotel fitness center and applied a questionnaire with 206 different customers to compare the dimension of service quality (customer expectations and perception). The data obtained in this work provided the hotel manager with knowledge on what the customer really needs to feel satisfied. The comparison between expectations and perception will be used to shape the expectations of the hotel in relation to the definition of service "standards" (Evans & Lindsay, 1993).
2 PURPOSE
According to the International Labor Organization (ILO) and the World Tourism Organization (UNWTO), the hospitality industry involves a range of sectors, such as lodging services, entertainment, and supply units.
Fitness in hotels is growing in importance regarding health and fitness lifestyle and recreational activities; the satisfaction of quality of service is apparent in the women and men’s bodies. The economic importance of these activities shows in the increasing number of fitness coaches and health professionals involved in this market. There are 30,500 fitness facilities, a quarter of a million fitness trainers and instructors, and nearly 60 million members who exercise. The US represents the world's largest health and fitness market, valued at $ 24.4 billion, according to the US Bureau of Labor Statistics (2012). This justifies the investments made (McMahon-Beattie & Yeoman, 2004, p. 188) and can generate employment opportunities in this industry in the next 10 years (US Bureau of Labor Statistics, 2012).
The purpose of this work is to structure a model to manage hospitality according to the customer vision on the most important attributes, i.e., the "customer focus". This model was developed to establish the quality of service because the organization must identify, measure, and report significantly to managers the service dimensions that need to be improved, according to the customer vision. The concept of poor quality is articulated as the misunderstanding of what the customer really needs. Therefore, the so-called "customer focus" methodology has been developed. For this, there are two measurement methodologies: SERVQUAL scale (Parasuraman et al., 1988) and QUESC (Kim & Kim, 1995). This is a systemic management methodology based on two key pillars:
(1) Culture of excellence, which focuses on business processes;
(2) Quality of service structure as a tool used to support service management.
Customer focus can help create cultures of excellence and guaranteed improvements in the way the organization uses internal resources, taking the workplace and employees to an excellent level of quality of service (Bouranta et al., 2009; Pelit et al., 2011). These fundamentals will meet customers and management satisfaction.
3 THEORETICAL BACKGROUND
3.1 Levels of Customer Satisfaction in services
Service measurement is a difficult task (Parasuraman et al., 1988, Carman, 1990, Lasten, Curtis, Upchurch & Dammers, 2014) because customer expectations are not all at the same level, as a series of unexpected performances. The SERVQUAL model proposed by Parasuraman et al. (1988) allows researchers to measure the difference between customer service expectations and their perceived experiences to compose a gap analysis in a multidimensional concept.
It is important to distinguish the factors that influence customer expectations and perception, because it depends on the development of the service in the actual moments of contact with the customer. It is a comparison between the range of expectations one has and the level of perception of the service provided. To Lewis (1989), quality of service is a measure of how well the service meets customer expectations. Bitner (1990) suggests that customer satisfaction assessments relate to specific service transactions and service quality is an attitude related to the service provider.
Despite its extensive application, criticisms of the SERVQUAL model refer: the application in different types of services and the nature of its construction (Carman, 1990; Babakus & Boller, 1992; Cronin & Taylor, 1992; Buttle, 1996), and its psychometric properties (Lam, 1997). According to Boulding et al. (1993), just a measurement of a performance would be insufficient. This idea is supported by Grönroos (1990), who states that consumers choose service providers by comparing their perceptions of received services and expectations. There are three possibilities for the comparison of expectations regarding the customer’s perception:
(i) Expectations < Perceptions (w): the quality perceived is good and has a positive value;
(ii) Perceptions = Expectations (y): the quality perceived is acceptable, or the value of perception and expectation are the same;
(iii) Expectations > Perceptions (z): when quality is not perceived, it has a negative value.
The SERVQUAL model is used in several sectors of the economy, it captures the dimensions of service quality in various sociocultural and/or economic contexts (Buttle, 1996). For example, the hotel industry was represented by three dimensions: employees, tangibles, and reliability (Wong et al., 1999).
Kim and Kim (1995) developed a scale based on perceptions of service quality delivery in fitness centers. This scale was specifically designed to measure service quality in fitness centers called QUESC. According to Athanasopoulou (2008) and Prentice (2013), it provides in-depth analysis on the relationships developed between sport service providers and their customers. Customer expectations and perceptions are important for service providers to determine the internal sources of quality of service problems. It consists of a formal articulation of how the company perceives the requirements and customer resources contained in quality management that have short- and long-term impact.
The present study assesses the service quality of fitness center services using a modified SERVQUAL scale, integrating a QUESC questionnaire proposed by Kim and Kim (1995).
3.2 Customer Satisfaction in hotel fitness centers
According to Kumar et al. (2008) the popularity of fitness centers is due to the need to minimize factors such as stress, sedentary lifestyle, unhealthy nutri-
tion, alcohol, and tobacco, among others, which characterize the modern lifestyle. Fitness centers in hotels provide a variety of services and facilities to attract various guests to stay and maintain their work out daily routine, in other words to stay in shape on their vacation. Many hotels offer this kind of service with modern equipment, a variety of exercise machines and free weights, and staff to supervise the fitness exercise program. In general, the hotel fitness center is open 24 hours a day and is free to hotel guests.
The importance of measuring customer satisfaction is key to retaining old customers and to attract new ones (Pechlaner & Volgger, 2012). The starting point of customer service satisfaction is to understand the elements or the quality dimension that most influence final customer decision. Satisfaction also has been defined as an emotional state created during a service experience (Baker & Crompton, 2000). It can be considered at two levels: the individual or encounter level and the overall satisfaction with a service (Bitner & Hubbert, 1994; Maxham & Netemeyer, 2002).
The literature on customer satisfaction in hotel fitness centers is relatively scarce, only a few studies can be highlighted because they have explored different and varied measurement items such as those by Chelladurai et al. (1987); Kim and Kim (1995); Sul (1999); Ellis (1999); Chang and Chelladurai (2003); Chang, C. (2013), Zhang and Law (2013). However, one of the most relevant works was elaborated by Kim and Kim (1995) who created the QUESC methodology, developed specifically to measure the service quality of sports center. The instrument has two parts: (i) the first part measures the convenience of a list of QUESC items; (ii) the second part, the same list of items is used to measure the perception of quality service delivered as SERVQUAL does.
3.3 QUESC methodology
The QUESC was developed in 1995 by Kim and Kim to conduct a quality assessment in sports center services in order to obtain a more complete and targeted approach. The instrument is composed of 42 specific items, which according to the authors can be applied to any type of physical activity service provision.
Papadimitriou and Karteraliotis (2000) used a factorial and exploratory analysis and a QUESC methodology to analyze the expectations of customers of public and private fitness centers. The study resulted in a four factor/dimensions model, namely: "Instructor quality", "Facility attractiveness and equipment", "Program availability", and "Delivery and other services".
Afthinos (2005) also carried out a study to verify which items were considered most important by customers according to gender, age, and goals, also using the QUESC instrument. Thus, the "Cleanliness" was considered the most important aspect, while the "snack supply" was considered the least important aspect. In addition, "knowledge of the professionals", "responsibility" and "courtesy of employees" were the highest ranked items in basic service delivery. Afthinos (2005) concludes that customer expectations emphasize the importance of physical elements in service delivery and in the interaction between employees and customers. Such results confirm the belief that people want an attractive workout area, personal attention, convenient design, and reasonable cost. On the other hand, the items related to opportunities are lower, a finding corroborated by the work of Kim and Kim (1995) and Papadimitriou and Karteraliotis (2000).
Chang and Chelladurai (2003) also conducted a survey of members of the American Fitness Club to develop a nine-dimensional scale for quality fitness services. The dimensions identified in the study were: (1) the service climate; (2) management commitment to quality of service; (3) programming; (4) personal interaction; (5) interaction of tasks, (6) other customers; (7) service failures; (8) service recovery; (9) perception of quality of service. Lagrosen and Lagrosen (2007) conducted a study that resulted in a model that did not qualify as quality dimensions in fitness services in two segments: Quality Dimensions and Facilitators. Regarding the "Dimensions of Quality" were identified by the variable factors, physical alteration, mental development, and pleasure. As far as the "facilitators" were concerned, they were divided into direct facilitators and indirect facilitators. The direct facilitators were as follows:
Technical Competence - related to the capacity of service provided by the required service. This factor also involves sophistication and the treatment offered by fitness centers.
Relational skills - customer assessment, staff demonstration, customer service, customer service, courtesy, and availability.
In addition to the direct facilitators, six other factors were identified as indirect facilitators. These are: (1) Facilities; (2) Training; (3) Evaluation; (4) Improvements/adaptation; (5) Climate; And (6) Leadership. In this paper, the "climate" was identified as a crucial factor. It should be noted that the service climate was also pointed out by Chang and Chelladurai (2003) as a dimension without a model developed by them. However, Lagrosen and Lagrosen (2007) also suggested four aspects that should also be included, namely: Organizational Awareness, Recruitment, Service Design, and Image.
As can be seen, there is no consensus in the literature about the dimensions or factors of greater importance for customers, also evidenced by Lam and Ocker (2004) in a review on this subject. However, it is important to note that, according to Lagrosen and Lagrosen (2007), they constitute a basis for the elaboration of mechanisms to evaluate the quality of service in the fitness industry.
In this sense, the SERVQUAL scale created by Parasuraman et al. (1985) is an important tool to evaluate the quality of services. Thus, the research instrument adopted in this work consists of the adaptation of the classic SERVQUAL model to evaluate customer expectations and perception of service quality, improved by the QUESC model, which consists of a specifically applied instrument for quality evaluation in fitness services in order to obtain a more complete and targeted approach, since the isolated models are not sufficient to evaluate a quality fitness center service (Moon et al., 2011).
4 THE PROPOSED APPROACH TO THE HOTEL QUALITY MANAGEMENT FOCUSED ON THE CUSTOMER
The proposed approach has 5 steps and 13 phases as shown in Figure 1; within the framework of quality the approach draws on the current literature focused on hotel fitness center guests. We consider hospitality management as the ability to identify and anticipate the needs of guests. In this industry, it is interesting to see the capacity of a fitness center as a system, for the development of policies, strategies and services, and the structuring of all service processes efficiently and effectively through its operations. Based on the literature review and at each stage, the reference used is cited. This proposed approach integrates SERVQUAL and QUESC with a customer focus. SERVQUAL and QUESC are the input to develop an appropriate level of service based on the customer’s vision. The five steps are described below.
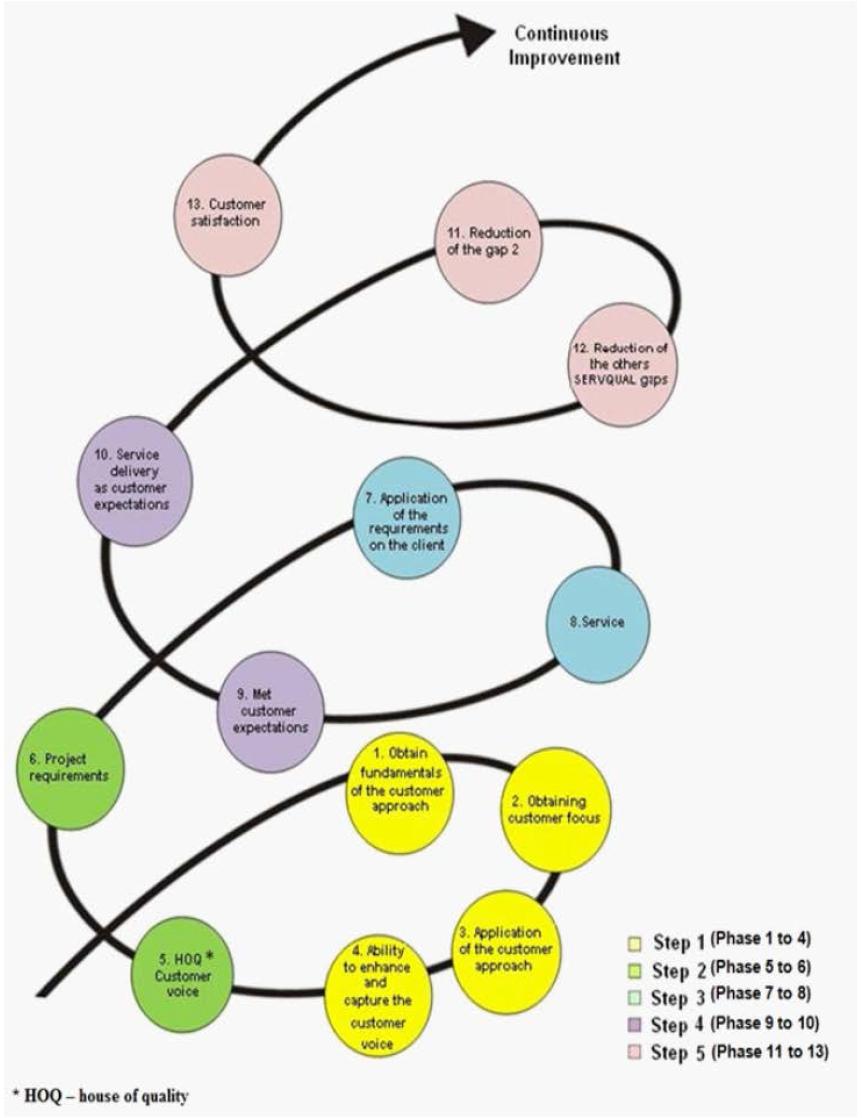
Step 1 - The first step consists of the following phases: I. Getting the basics of the customer approach (Lewis, 1989); II. Customer focus (Bitner, 1990, Cronin & Taylor, 1992, Kim & Kim, 1995); III - Application of the customer approach (Parasuraman et al., 1985); IV. Ability to improve and capture the voice of the customer (Bouranta et al., 2009; Pelit et al., 2011). These phases are the first cycle of the structural approach shown in Figure 1. The first step is to apply the SERVQUAL scale. The original SERVQUAL questionnaire was adapted to evaluate the customer expectations regarding the service delivery with customer focus vision (Smith, 2009). This questionnaire has 35 questions, derived from the 22 original SERVQUAL questions and 13 questions based on the QUESC model to better understand the needs of the invited customers in order to provide specific measures of the service, it should identify which dimension better meets the customer’s needs. Each dimension of perceived service is measured using a five-point Likert scale: "How much do you agree or disagree with these statements?" with options ranging from (1) strongly disagree to (5) strongly agree.
Customer satisfaction is calculated as follows: expectation> satisfaction, it can create gaps equal to or greater than -1. To reduce a potential bias resulting from incorrect responses when using the SERVQUAL questionnaire, each question was asked multiple times over time to get an accurate answer. This first step is intended to understand the types of customers and the services provided. The SERVQUAL instrument can capture the customer's voice. The information obtained at this stage will determine the strategic direction of the organization.
Step 2 - This step consists of the steps shown in Figure 1: V. (House of Quality) - customer’s voice (Prentice, 2013); and VI. Project requirements (Buttle, 1996; Carman, 1990; Kumar et al., 2008). This step begins with the information collected in the previous step. These data have identified the order of importance of quality dimensions in relation to customers’ expectations of the service provided by a fitness center. The HOQ is divided into two steps: (i) verifying how the customer imagines the ideal service - the service requirements are complex, it is not just meeting customers’ expressed needs, because some customers have unexpressed needs, they do not have an adequate priority set. These aspects do not justify the allocation of resources to what needs to be done to develop quality management. The other stage is (ii) the evaluation of the perception of the service offered - the information collected by the SERVQUAL questionnaire can help managers diagnose where performance improvement can be directed. The biggest negative gaps combined with an assessment of where expectations are high and make it easier to prioritize the improved performance of the fitness center. Likewise, if the gap scores in some aspects of service are positive, what implies expectations is not only to be met, but exceeded. This allows managers to review whether there is potential for re-deployment of resources in resources to improve service performance.
Step 3 - This step includes phases: VII. Application of the requirements on the customer (Pechlander & Volgger, 2012); VIII. Service (Parasuraman et al., 1988; Cronin & Taylor, 1992). In this phase, the manager needs to understand the requirements obtained from the previous Step 2. In this step, the manager should correct some mistakes of the requirements regarded for customer satisfaction to establish what the business should include in the fitness center services. Failures resulting from this step may cause bias or errors in subsequent steps. This procedure relates to reducing and eliminating the SERVQUAL gap 2, this gap associates the management perceptions and the service specifications. These issues arise from a different view between management perceptions of customer expectations and the service specifications or requirements. This gap can result in an inadequate management commitment and interest, inadequate task standardization, wrong perception of feasibility - when the company cannot meet customer’s requirements, and an absence of goal setting to specify in detail what is required in relation to the customer’s needs.
Step 4 - This step corresponds to the use of the information in Step 3 and includes phases IX. It meets customers’ ex-
pectations (Maxham & Netemeyer, 2002) and X. Provision of services as customer expectations (Parasuraman et al., 1988, Cronin & Taylor, 1992; Pechlander & Volgger, 2012), as shown in Figure 1. In this step the manager must build the relationship matrix. However, the customers' voices are diverse; There are a variety of different needs. One technique to do this is to use the matrix that defines the customer's needs or requirements and translate them into specific strategies. The fitness center understands the customer needs, after being summed up in the planning of ideal services. The hotel fitness center can alienate its internal resources and its ability to provide a quality service according to the perceptions of its customers. To achieve quality of service, the strategy must identify two different dimensions according to Stepanovich and Mueller (2002): the external environment focuses on its main objectives and uses its resources, capabilities, and strategies efficiently; And the internal environment focuses on employees to combine functional strategies. For Hill and Cuthbertson (2011), these relationships change the impact on business performance. The hotel manager must determine the actions and areas required to obtain value from business objectives.
Step 5 - The last step is composed of three phases: XI. Reduction of Gap 2, XII. Reduction of the other SERVQUAL gaps and XIII. Customer satisfaction planning (Buttle, 1996; Kumar et al., 2008; Ladhari, 2009). To reduce Gap 2, the manager must confront the service specifications and service delivery to elaborate a customer satisfaction planning to minimize the role ambiguity and conflict, poor employee-job fit, inappropriate supervisory control systems, lack of perceived control, lack of teamwork, and inadequate upward communication. It influences other SERVQUAL gaps to assess the level of service quality and to enable customer satisfaction with the service provided (Gray et al., 2000). The three important gaps, which are more associated with the external customers are Gap 1 - Customers’ expectations versus management perceptions, Gap 5 - The discrepancy between customer expectations and perceptions of the service delivered and Gap 4 - The discrepancy between customer expectations and employees’ perceptions, because they have a direct relationship with customers.
These gaps are analyzed to reduce the managerial ambiguity of the manager, according to customer view. At the end of these analyses the fitness center must plan customer satisfaction. This is the process of thinking about and organizing internal procedures of the firm in order to satisfy and exceed customer requirements and to achieve a desired goal. After identifying the items desired by the fitness customers, it will be possible to determine internal requirements to fit their needs in the guest customer satisfaction planning.
This management factor is composed of the tangible facilities and modern equipment, it includes: training equipment and tools used to provide beauty treatments. This factor had a direct influence of technical competence of the fitness center employees, including the training exercises, personal training services, and adequate provision of treatments. The internal environment refers to a harmonious collaboration among the employees and customers (Karatepe, 2011). Training is the process of enhancing the skills, capabilities, and knowledge of employees for doing a particular hotel fitness service. Formal internal mechanisms to reinforce employees’ knowledge of norms and work procedures are also implemented for the fitness employees in all phases (Herstein & Jaffe, 2008). The good leadership refers to the manager’s ability to motivate and encourage their employees.
This paper’s framework indicates:
5 THE APPLICATION OF THE PROPOSED FRAMEWORK
5.1 Description of the sample
The questionnaire is composed of two parts; the first part used nominal scales to collect basic information about the respondents, while the second part was comprised of the theoretical constructs of SERVQUAL and QUESC to measu-
re respondents’ perception regarding the continued use of fitness center services. All the 35 questions were originally adopted from prior research, whereas some appropriate revisions were applied to make the measurement fit this research context. The measure of each theoretical construct consisted of multiple quizzes using a 5-point Likert scale ranging from (1) strongly disagree) to (5) strongly agree.
The interviews were a conversational form, and a fixed set of questions was used based on the SERVQUAL and QUESC models. First, the investigator gets approval from the fitness center manager because the interviews were held at the premises of the companies. Some companies accepted the invitation, some did not for some reason: not interested, no time, and so on. This process takes a lot of time, about six months, and the customer research was done in two months. The study involved 20 successful hotel fitness centers and 206 guests of these hotels.
These hotel fitness centers offer different types of service: strength training sessions and yoga exercises, weight lifting, gymnastics, jumping, pitch, spinning, boxing, and jiujitsu. The mission is to ensure the wellness and entertainment of customers through physical exercise. These hotels have requested an upgrade of their gym facilities during the stay of the guests, helping the customer to do their training, exercise, or cardio-program exercises.
5.2 Identification of Customer Profile
According to the data obtained from the 206 respondents, 50.27% are males and 49.73% are females; This sample has a mean age of 26.6 years and 77% is between 21 and 25 years old, with young people having a higher prevalence among guests and, for that reason, the gym is focused on this group.
The reasons for going to the gym are: weight control, aesthetic reasons, physical fitness, socialization, health, and others. Among these main objectives, the respondents seek the services offered by the fitness center for: health (46%) and esthetic reasons (29%), weight control (25%). Of these, 64% of customers have used the same services in other hotel companies and 36% have never used the same services. The main reasons for choosing the hotel's fitness facilities are: the location is well known by the guest or near the accommodation (35.28%) and the variety of equipment and gym facilities (28.13%) were the main reasons to go to the fitness center of the hotel. Regarding the intensity (61%), the customer stays in the gym to do their exercises between 1 and 2 hours per visit, 33% of respondents remain within 1 hour. Finally, the pre-exercise time is: night (58%), afternoon (16%), morning (26%).
The majority of the public that uses hotel gyms are the guests themselves, however, on the payment of a monthly fee, the residents of the region can also use it. These two types of customers, have similar characteristics, i.e. they use equipment for a better quality of life or maintenance or loss of weight; need the supervision of a professional in physical activity for better performance in the gym. In this work, the surveyed public that uses the hotel's gyms were the guests themselves.
5.3 Application of SERVQUAL with customers
The third part of the questionnaire has 33 items to evaluate the perception and expectations on the gym or fit service offered by the hotels. The information of general gap score obtained from the application of SERVQUAL scale, applied to 206 customers. The data segmented by age were divided into four categories: 15-20 years, 21-25 years, 26-30 years and above 30 years. Appendix 1 shows the general data by age, obtained from the application of SERVQUAL.
The dimension reliability represents the ability to perform the promised service dependably and accurately, has the bigger and negative gap value (-0.9) than the others quality dimensions. Three important discrepancies or gaps related to the managerial perceptions of the quality of the hotel's fitness/gym service and tasks associated with the delivery of the customer's fitness service were identified:
Assurance is the knowledge and courtesy of the trainers’ employees and their ability to convey trust and confidence according the guest customer view. A gap of (-0.6325) was found and re-
vealed an inadequate commitment to quality of service, perception of infeasibility, inadequate task standardization or absence of goal setting.
QUESC correspond the discrepancy between customer expectations and their perceptions of the service delivered. In this study, this gap has the value of (-0.784). The authority of the customer expectations is influenced by the extent of personal needs and past service experiences.
Responsiveness shows the discrepancy between customer expectations and employees’ perceptions, the result was (-0.665). It is the willingness of employees to help the guest by providing prompt timely services. This is the result of the differences in the understanding of customer expectations by front-line service providers in the hotel fitness.
The customers were grouped by age and objective pursued with the fitness service in order to obtain a more detailed understanding about the points of convergence and divergence according to each segment specified. Segmentation by gender shows that there was no significant difference between male and female responses, because the percentage of occurrence was quite the same.
The largest gap in expectations was observed in the 21-25-year category or 77% of the data sample: 8 (-0.89) - Instructors or employees are involved and committed to quality and to improve services (-1.22) - Accident and emergency safety measures, 32 (-1.2) - Innovative programs to encourage customers' exercise, 31 (-.98) - Customer problems are solved quickly, - Security of personal belongings in lockers and 33 (-1.36) - secure parking.
Regarding the reasons for choosing a hotel with gym; Three main reasons were identified for using hotel facilities according to the sample: health, cosmetic reasons, and weight control. These objectives were used for the SERVQUAL analysis presented in Appendix 2. But first, it is necessary to understand the meaning of each, as described below:
Esthetic reasons and weight control: The fundamental role of fitness services is to assist the guest to maintain the workout routine for physical status, away from their home and their gym. It is a physical change, refers to the various aesthetic objectives of the customers in terms of bodily appearance, for example: get slimmer body, enhanced muscle mass and strength, smoother skin, or in general, to get a healthier look.
Health: Many guests use hotel fitness center to improve their mental and physical status through specific programs (such as yoga, meditation, cholesterol, and diabetes programs). It refers to the customers’ various objectives in terms of relief from aches and pains. The benefits include the internal sensation of harmony, happiness, calmness, mental relaxation, self-realization, enlightenment and taking care for oneself.
The objective of "Weight Control" was to find gaps in the items: 8 (-0.895), 12 (-0.985), 14 (-0.845), 16 (-0.865), 28 (-0.86), 29 (-0.895), 30 (-1.005), 31 (-1.41), 32 (-1.75) and 33 (-1.88). For the "Esthetic reasons" objective, the items that presented gaps greater than -1 were: 24 (-1.32), 31 (-1.41), 32 (-1,525), 33 (-1,605). Finally, the "Health" objective presents major gaps in these items: 24 (-2,182), 30 (-0.9825), 31 (-1.2825), 32 (-1.509), 33 (-1.4755).
The SERVQUAL instrument was applied to the gym’s management to assess the perception of the service offered and of customer expectations. The findings show that regarding management’s expectations and perceptions on the service offered, the largest gaps were found in the items: 4, 11, 21, 23, 24, 27, 30, and 33. Thus, to improve the service the management should focus primarily on the items with a gap > -1. Among the items with larger gaps for management, four gaps have negative disclosed view to the customer: 30- Innovation programs in order to encourage customers, 31 - Safety measures against accidents and emergency procedures, 32 - Security of personal belonging in lockers and 33 - secure parking.
5.4 Importance of quality dimensions of management
The second part of the questionnaire was applied to the hotel manager to know the importance of each dimension of quality and to compare the views of management and guests. It should be noted that the manager considered all dimensions of equal importance to customers, since a maximum score for each dimension has been assigned. However, the customers considered the security dimension the most important and, in second, the reliability dimension. But the tangible dimension was considered the least important.
Hotel managers could benefit from adopting a systematic view of their organizations. The framework presented in this study can be a basis for designing service considering the quality dimensions specified here. The data can also be used to make decisions about customer priorities. In this sense, we observed that the tangible dimension affected two great dimensions: security and reliability. It is important to consider, at the basic level, one of the five dimensions are still affected by time and cost constraints. These restrictions may determine the choice of the fitness center: (I) physical trust in standards, hygiene, price (II) social - identifying the type of establishment and status, individualized attention to customers.
6 SENSITIVITY ANALYSIS OF RESULTS
A statistical analysis of disconfirmation paradigm defined by Lewis and Booms (1983) was also conducted to determine the standard deviation of 33 items on the questionnaire. The squared Euclidean distance and the sum of the affirmatives for all groups that showed a correlation between the score in the affirmative and the total points on the instrument, according to the Spearman test (rs), on the expectation and perception scales. The rs coefficient varies from -1 (perfect negative correlation) to +1 (perfect positive correlation), and can relate directly or inversely. If rs is zero, this means that there is no correlation. To calculate this coefficient, the positions that the values of variables have, in ascending or descending order, are considered, as shown in Equation 1:
where:
rs = Spearman correlation coefficient;
6 = constant;
di = difference between the positions relative to the two features;
n = number of observations (sample size).
A value of rs = -0.597 in the results means that there is no association between the two variables (Expectations and Perceptions), where the negative value means the monotonic association, the variables decrease in value together.
A statistical hypothesis test is a statistical inference that determines what the results of a study would lead to a rejection of the null hypothesis at a pre-specified significance level (α) of 95%. The critical region of a hypothesis test (h0) is the set of all the results that make the null hypothesis rejected in favor of the alternative hypothesis (h). In this study, the sample is derived from the Student’s t-distribution. Table 1 shows the results of the statistical inference method.
Table 1 Statistical hypothesis Student's t-distribution
| ANOVA | |
| Hypothesis h0 = 0,0 - Service Satisfaction h < 0,0 - Service not Satisfaction | |
| “p” sample value = | 0.580649 |
| gl | 5 |
| Significance level (α) | 95% |
| Probability value | Less than 0.25 |
| Result: Rejected h0 | |
The p value (0.5806) is less than the 95% significance level required or the data sample is in the critical region of the statistical analysis, in which case the null hypothesis is rejected. One can accept the alternative hypothesis that confirm that sampled customers have no satisfaction in the services of the fitness center.
Another analysis performed is blocking statistics (Table 2), is the organization of experimental units into groups or blocks that are similar to each other. In this study, the number of 40 questionnaires was divided into five blocks, applying the questionnaire five times in different periods. This analysis reduces the sources of variability and therefore leads to greater accuracy (Aschbacher, 1971).
Table 2 Blocking Statistics
| ANOVA Blocks | ||||
| Hypotheses h0 - Set of data sample properties are similar h - Set of data sample properties are different | ||||
| Source of variation | Sum of squares (SQ) | gl | Mean squares (MQ) | f |
| Between treatments | SQ treat. =18.55 | 32 | QM treat. = 0.579 | QM treat./ QM error = 7.1 |
| Between blocks | SQ bloc = 3.77 | 4 | QM bloc.= 0.943 | |
| Within (error) | SQ error = 10.51 | 128 | QM error= 0.0821 | |
| Total value | SQ total =32.82 | 164 | ||
The study adopted the "α" value of 0.05, which means the value of 95% confidence. The critical value of this sample is 1,031, with 32 degrees of freedom (gl) in the numerator and 128 in the denominator. The value f is 7.1, is obtained from the division of the mean squares between treatments and between blocks. The value of f is greater than the critical value, and therefore the sample data is within the critical region. Then, the test accepts h0, proving that there is no statistical difference between the sample blocks collected, in terms of customer perception and expectation.
Another test that can be done is to analyze the association when the variable probability of an event is changed depending on the other variable. This analysis is done by the qui-square test of independence. This test will confirm whether a dimension-quality variable can influence the other. You can change the final result of the study of the application of the SERV-
QUAL and QUESC questionnaire. It is known that two events are independent if and only if the joint probability of intersection is equal to the product of the probability of each event. This test verifies that the five qualitative variables have mutual influence. Based on a sample of 206 observations, it is organized in the contingency table corresponding to the five quality dimensions. The test statistic is a measure of the distance between the observed frequencies expected by the following Equation 2.
Oij is the observed frequency and Eij is the expected frequency. Subtract the expected frequency count from the observed count to find the difference between the two variables (also called residual value). A survey of customer opinion surveyed in a simple random sample of 206 respondents was rated as five-dimensional quality. To facilitate the counting of five-dimensional frequencies, the Gap Average value was adopted, when the result shows that the Gap Frequency > Gap Average means that the customer is satisfied and when the Gap Frequency < Gap Average means that the performance was not as expected by the customer (this quality of service behavior should be avoided in the future). The results are presented in the contingency Table 3 below.
Table 3 Contingency Table
| Dimension | Gap Average | Gap frequency > Gap Average | Gap frequency < Gap Average |
| 1- Tangible | -0.4575 | 0.8 | 0.2 |
| 2- Reliability | -0.9 | 0.4 | 0.6 |
| 3- Responsiveness | -0.665 | 0.4 | 0.6 |
| 4- Assurance | -0.6325 | 0.4 | 0.6 |
| 5- Empathy | -0.31 | 0.8 | 0.2 |
| 6- QUESC | -0.784 | 0.4 | 0.6 |
The value of q 2 was calculated by the following procedure:
q
2 <
q
2 ≥
In this sample, q
2 has the value of 16.496, and gl of 5. By convention, was adopted the cut-off point or the significant level (α) for a p-value is 0.05, A value of 11.07 was obtained for the
An advantage of SERVQUAL is the discussion of gaps between the weaknesses of a fitness center service and the potential to prioritize management issues. It is necessary to measure the perception of the customer to adapt the actions according to the knowledge about these gaps. To fully appreciate the benefits of using SERVQUAL, surveys must be administered repeatedly (for example, every year) on a regular basis for the following reasons:
Allow annual comparisons of gaps in the service;
Understand the market through benchmarking;
Determine how service improvements have affected the needs of fitness center customers over time;
Determine the effectiveness of service development and enhancement initiatives addressing the key service dimensions or prioritizing service requirements.
6.1 Comparison between customer and management expectations
Quality service expectations sometimes match or are aligned with what management believes. The SERVQUAL scale can help managers to maintain the firm within this principle. In this sense, it was observed that 12 items of customer expectations are equal to hotel management expectations, 2 items of customer expectations are higher than management expectations and for 21 items, customer expectations are lower than management expectations. For this scenario, you need to have a closer relationship with customers to get focus.
It is important to note that the measurement system is an important tool to promote quality, but some customers do not have the motivation to respond correctly when asked. The hotel fitness center should be suited to win the customer's attention, for example: an exciting fitness atmosphere, personalized workouts, support for customer
networks after the gym and others.
6.2 Comparison between customer and management perceptions
According to Jerônimo and Medeiros (2014) many attributes are important from the customer view. Otherwise, the manager should not apply great efforts to enhance the customer satisfaction (Ellis, 1999; Zhang & Law, 2013; Chang, 2013). According to this view, it was observed that in 21 items the customer equals management perception, in 3 items customer perception is greater that management and in 11 items customer perception is less than the perception of management. This happens because the perception of service refers to the evaluation of the attributes that are already being offered by the hotel fitness center.
7 CONCLUSIONS
This paper constructs a methodology for measuring hotel quality service, specifically the fitness service. The main feature of the methodology is the customer view, wherein it is possible to identify the profile and preferences, i.e. to identify the quality attributes in the right position according to the customers’ view (Yoon et al., 2001).
Hotel fitness centers exhibit a complex set of factors and influences, which can be translated or reflected in a holistic way by quality dimensions. These dimensions can be applied as attributes, operational manage-
ment, financial control, marketing, access to information and customer focus; keeping up to date with market changes, people employed, forward planning, technology, and innovation. The purpose of this research was to undertake the proposed model of customer focus to provide a new way of thinking of hotel fitness management. Great customer service is critical for attracting repeat customers and building positive and respected hotel brand image.
Customer-focus management is inclined to concentrate on customer quality measurement. The need for this methodology is strongly supported by the lack of conclusive studies on quality measurement methods related to fitness centers. This study also addresses the gaps between expectations and perceptions of fitness service, and the important dimensions of the factors that most affect the performance of the organization. In this sense, the framework presented here, provides valuable insights into the features that are crucial for creating quality to the hotels. In this sense, guests always are looking to upgrade and customize fitness spaces that convey the idea of health and esthetics benefits.

