


 texto em
  Inglês (pdf)
 Artigo em XML
 Referências do artigo
 Enviar este artigo por email
 Citado por SciELO
  Similares em
SciELO
Similares em
SciELO 
 Permalink
INTRODUCTION
Consumption permeates the lives of everyone in society (Peter & Olson, 2009). "Being a consumer is to be human "(Karsaklian, 2004, p. 13). In this scenario, the importance of consumers and customers is indisputable, since companies, in the midst of competition, seek to diversify the way they offer the products and services that consumers need in order to make them loyal (Peter & Olson, 2009).
Peter and Olson (2009) posit that the consumer is dynamic as well as the environment in which they are immersed and where changes are permanent. Such transformations have affected, among others, the food sector (Lima Filho et al., 2004).
Food was limited to the domestic environment; it was the woman's responsibility to cook and feed her family. However there have been changes in society that affected these habits (Diez Garcia, 1999), particularly an increase in the eating out frequency (Leal, 2010; Sanches & Salay, 2011). In 2013, 32.9 percent of the food consumption of the Brazilian population occurred outside the home (ABIA, 2013). This phenomenon is due to the fact that people replace the consumption of traditional foods for quick and easy food preparations (Schlindwein & Kassouf, 2007).
Street food appears, in this context, as a financially viable option by offering diverse and ready food for immediate consumption, meeting the growing demand for convenience food (Cardoso, Santos & Silva, 2009). This type of development has become common in Brazilian cities and also abroad (Cardoso, Santos & Silva, 2009). Globally, around 2.5 billion people eat street food daily (FAO, 2011).
Pigatto and Nishimura (2012) claim that street food vendors operate in an extremely competitive market, due to the fact that food service has a large variety of offer, in addition there are no barriers to entry, it does not require high initial investment and offers short-term financial return (WHO, 1996; FAO, 2011). In this context, a key factor for advantage, to adapt to new requirements, to ensure the survival and longevity in the market is to assess which attributes present in products or services generate customer satisfaction (Pelissari et al., 2011; Machado, Queiroz & Martins, 2006).
Within this setting, the following issue arises: what are the determinant attributes in the buying decision making process, in a square in Vitória/ES which has street food market? In order to answer this question we classified the attributes according to Alpert's (1971) proposal and developed a scale of measurement of the attributes in the context of street food.
Thus, the theoretical hypothesis to be tested in this study was: H: there is a difference in degree of importance attributed by customers, to attributes. When testing this hypothesis, it is possible to sort the attributes in their degree of importance, according to Alpert's (1971) typology, which is one of the goals to be achieved in this research.
The results of this study contribute to extend the scope of street food research nationwide, and also it is relevant for entrepreneurs to establish strategies to allocate its resources assertively, improve the market positioning, obtain better financial results, attract new customers and keep them satisfied.
2 THEORETICAL FRAMEWORK
The importance of the attributes in the buying decision
Attentive to the needs of consumers, the modern businessman shows a growing interest in the decision-making process research, in order to understand how consumers make buying decisions in a competitive environment (Bandara, 2014).
Vieira and Slongo (2008) say that every object of consumption can be envisaged by the consumer as a set of attributes that influence at the time of purchase. Therefore, knowing the attributes and their values is considered an important aspect, responsible for purchasing decisions (Vieira & Slongo, 2008), since it is common for consumers to define a product according to its attributes and, from the perception, they make buying decisions (De Moura, Nogueira & Gouvêa, 2012).
De Moura, Nogueira and Gouvêa (2012, p. 77) explain that "[...] an attribute can be understood as a feature, component, or function that a product performs [...] ", which encourages the consumer's buying decision. Hawkins, Mothersbaugh and Best (2007) highlight the choice based on attributes such as one of the ways to assess the alternatives to make a purchase.
In this context, there is a consensus in the literature in which authors (Alpert, 1971; Mowen & Minor, 2003; Engel, Blackwell & Miniard, 2005; Zeithaml, 1988; Taplin, 2012) consider that the attributes differ considerably in importance that they have for consumers, i.e., the importance of the attributes of a product can vary considerably from one consumer to another, according to the specific characteristics of each individual (Engel, Blackwell & Miniard, 2005). Alpert (1971), from the conception that there are different degrees of importance in relation to the attributes, and that this importance influences the purchasing decisions, we propose the following classification of attributes:
Salient Attributes: are the attributes that consumers can perceive in a given product, brand, company or institution, but do not determine the buying process (Alpert, 1971). McMillan and McGrath (1996) explain that these attributes will only influence directly the purchase as a tiebreaker, i.e., if all the other product features are equivalent.
Important Attributes: are those perceived by a certain group of consumers as important at the time of purchase, but which not determine it (Alpert, 1971). These are aspects that are not able to determine the choice of purchase and therefore does not influence or add value by the fact of being present in a similar category of products (Alpert, 1971). Thus, many do not consider the important attributes because these are present in all products of a given class (Alpert, 1971).
Determinant Attributes: for Alpert (1971) they are of great importance to the consumer, influencing the buying decision. Thus, these are perceived as the best option to maximize satisfaction and achieve the desired values by the consumer. Effectively, they are able to direct the choice. The determinant attributes present themselves for the consumer as the best possibility to answer to the satisfaction of their desires in a specific product or brand (Alpert, 1971).
This research is based on Alpert's (1971) classification of the different degrees of importance of the attributes, highlighting in particular the determinant attributes identified in the marketing of street food.
The next topic focuses on present aspects related to food outside the home, which consists of a habit present in the daily life of individuals, in which a range of ventures in this attractive market, as is the case of street foods.
Street Food: An alternative to food outside the home
In contemporary times, some transformations in the productive structure have had a considerably effect in the daily life of individuals (Fantinel, Teixeira & Ghizzo, 2011). Aspects such as the integration of women in the labor market, overwork, heavy burden of study, traffic congestion, among others, make time precious and scarce in people's lives, which consequently brings about changes in the habits of people and groups, including with regard to food. In this context, people search food services outside the home, because they satisfy their food needs in the time they have available (Fantinel, Teixeira & Ghizzo, 2011; Diez Garcia, 1999, Lambert et al., 2005, Balogun, Souza & Pereira, 2013; Schlindwein & Silva, 2010).
Consumption of food outside the home is increasingly common in everyday life, happening frequently. It is a worldwide phenomenon, either in developed countries or in developing countries (Bezerra, Souza & Pereira, 2013; Fantinel, Teixeira & Ghizzo, 2011; Edwards, Hartwell & Brown, 2013; Nordström & Thunström, 2015). The trend is that new food niches outside the home keep popping up (Liu, Kasteridis & Yen, 2013; Mauro, 2013).
An example of the new trends in food out of the household is the emergence of a new segment originating from the street food sector, the so-called food trucks, which consist of small trucks or vans that specialize in serving different kinds of food; they are practically mobile restaurants (Piza, 2014). In São Paulo this market segment has strengthened, especially after the regulation of the activity, with the approval of the bill regulating street food vending in the city (Simon, 2013). Street food is becoming an option that supports the development of the habit of eating out (Castro, 2008), comprising a viable alternative for a large part of the population (Santos et al., 2012; Cardoso, Santos & Silva, 2009)
Studies conducted by the American Institute IBISWorld (2014) point out that street food vendors are in a growth phase. They were able to avoid recession and offer new products capable of attracting a more diverse clientele (IBISWorld, 2014). The food is varied and attractive for tourists, with many options of local cuisine, appreciated for its flavor (WHO, 1996; Rane, 2011; Newman & Burnet, 2013; Pigatto & Nishimura, 2012; Samapundo et al., 2015). Also, it is an important source of income, as it provides livelihood for a large number of workers, in particular in developing countries (Santos, 2011).
This type of food is part of everyday life, present in places near the commercial areas (Cardoso, Santos & Silva, 2009), as well as industrial facilities and squares (Muyanja et al., 2011). Normally these are lively places, with immediate and numerous clientele (Muyanja et al., 2011).
METHODOLOGY
Aiming to unveil the determinant attributes to consumers in the buying decision in street food establishments, this study analyzed the street market in the Praça Regina Frigeri Furno, a square located in the city of Vitoria, ES. The subjects of research are the street food consumers of the establishments in the square.
This street market began in the 1990s and currently, the City Hall of Victory is in charge of its management. The market is part of the program of "Community Regional Fairs", created by Law No. 5,949, of July 16, 2003. The space of the market has an exhibition and sale of manufactured crafts, food, and toys. The goal of this space is to encourage leisure, community integration and organized trade, respecting the legal limits to its installation and operation (BRAZIL, 2003).
The square today is a place with great variety of foods with approximately 43 food booths. It works from Wednesday to Friday, from 5:00 pm to 11:00 pm. Fridays are the busiest days, with a large number of people.
To respond to the problem proposed in this study, we developed two research stages: one that uses qualitative exploratory methods - since it is a little studied subject and with a lot of gaps to be filled, initially we developed a preliminary study in order to adapt the measuring instrument to the reality of the context - and other that is of a quantitative descriptive nature - aiming to describe certain specific characteristics of the market and relevant groups for this research (Malhotra, 2006), which enables to establish correlations between variables (Vergara, 2011), as follows in the next topic.
Qualitative Stage: Interviews with the customers
The qualitative stage included individual interviews carried out with customers who consume street food on the analyzed square, with the aim of identifying the determinant attributes in the purchase decision. Sixteen interviews were conducted, until reaching saturation point, divided into two different days of operation of establishments, June 3 and 12, 2015.
Data was analyzed through content analysis, which consist of "[...] a set of communication analysis techniques, using systematic and objective procedures to describe message contents [...]" whose relevance lies in the findings that result from their treatment (Bardin, 1977, p. 38).
After this analysis the responses were categorized (Bardin, 1977). The categories identified in the interviews in the qualitative phase, along with the attributes found in the literature, were used to identify and define the attributes to be included in the questionnaire survey, used in the quantitative phase of this research.
Quantitative Stage: Survey
In this stage, the primary data were obtained through the survey technique, i.e., data collection, which according to Hair et al. (2005), is a technique that uses a questionnaire to gather information about a population from a significant sample.
The questionnaire was structured with close-ended questions, using a six-point ordinal scale. Malhotra (2006) explains that the ordinal scale is a graduated scale, in which it is possible to assign numbers to certain items to indicate to what extent a characteristic is present in a given thing, and thus it can be determined if an item/object has this characteristic to a greater or lesser degree. In this scale the degree of agreement grows if a greater number of points are marked with declarations relating to the attitude that is being measured. A central or neutral point was not considered in order to avoid the central tendency. The objective was that customers indicated a positive or negative position rather than a neutral attitude.
This definition was based on the theory of Garland (1991), which states that researchers, in particular in the field of marketing, seek answers that assume a definitive position, without a central category. Garland (1991) argues that a central category can distort the results.
Before the application of the questionnaire we run a pre-test with 10 subjects to check the clarity of the questionnaire, the scope of the questions, as well as the acceptability of the questions by respondents, and thus making the necessary corrections (Rea & Parker, 2000)
Data collection initiated after the adjustments and completion of the survey questionnaire. The survey took place in two consecutive weeks, on Wednesdays, Thursdays and Fridays (operating days of the street market), in the month of June 2015 (17, 18, 19, 24 and 26). It is important to note that the dates for data survey was chosen disregarding vacation or holidays, because due to these aspects changes could occur in the field of study. Data analysis was performed through Excel on the statistical software tool SPSS (Statistical Package for the Social Sciences).
In relation to sampling, Malhotra (2006) states that the size considered ideal to ensure a robust research to estimate market trends should be of 200 samples. Another way of defining the sample is using the formula for interval estimation of a population mean based on Anderson, Sweeney and Williams (2002). For this calculation it is necessary to determine the confidence interval, the sampling error and standard deviation of the population. To set the size of the sample of this research, the confidence interval considered was 99 percent with a critical value Z equal to 2.57 and an error of 0.226.
Anderson, Sweeney and Williams (2002) explain that, when the population standard deviation is not known, one alternative is to adopt the standard deviation found from a pilot study done with a preliminary sample. Thus, the sample standard deviation used for the calculation of the sample was obtained from a study conducted by the researcher, prior to the development of this research, in the same population studied here. On that occasion 51 samples were used, in which the value of the standard deviation obtained was equal to 1.240809. Thus reaching the 200 samples needed (n = 200), according to the formula below.
The sampling was probabilistic, in which each element of the population has the same chance of being included in the sample, allowing for better representation of the population (Malhotra, 2006). The systematic technique was used, i.e. each interviewer started from a given point. From that point the first table was chosen at random and, in the sequence, each two tables occupied, one was addressed. When the subjects were in groups, only one of the persons was selected to respond to the questionnaire, this was the first on the right, except for the cases in which this first person was under the age of 18 years or was eating there for the first time. In these cases, the next person on the right answered the questionnaire.
ANALYSIS AND DISCUSSION OF DATA
This section presents the data collected from the customers who consume street food in the Jardim da Penha square.
Analysis of the Qualitative Stage
In this step, we tried to identify which attributes are considered most important by consumers when buying street food, in order to gather data to structure the questionnaire with the attributes inherent to street food consumption. The data generated from these interviews were studied through content analysis, which resulted in a list of attributes and their respective categories.
Bardin (1996) explains that to perform a content analysis it is necessary to develop three steps: pre-analysis, exploration of the material and treatment of the results (inference). In pre-analysis we read and selected the materials to be evaluated: the studies that used scales related to food consumption in various types of restaurants and the interviews. Thus, the analysis of content included two corpora: the material obtained in the literature review and from the semi-structured interviews carried out with customers who consume street food, generating a list of attributes.
The exploration stage is the moment of encoding, wherein the attributes that have the same meaning were aggregated. Later, each of these coded groups was named according to its meaning. To define those who would be used in the study, it was considered the number of appearances, i.e., the frequency, as well as the adequacy to the topic and object of study. Finally, the categories were defined. To create the categories of this study, we used the semantic criterion, i.e. the themes that are semantically linked to a category, defined by the author, are grouped together (Bardin, 1996).
A total of eighteen (18) attributes were defined, divided into five (5) categories, as shown in Table 4. After the conclusion of the content analysis we structured the questionnaire survey, the data collection instrument, used in the quantitative stage of this work.
Table 1 Data from Exploratory Factor Analysis
| Dimension | KMO and Bartlett | Cumulative Variance | Description of the components | Excluded Variable |
| Food | .753 .000 | 56.055 | Component 1: Presentation, taste, smell and temperature. This component was called organoleptic characteristics of food. Component 2: Variety and Hygiene. This component remained in Food category since it is related to food non-organoleptic characteristics. | Alimento saudável |
| Environment | .742 .000 | 55.036 | Structure, Familiar Atmosphere, Open Environment, Security | ----------- |
| Service | .655 .000 | 60.282 | Fast service, Good Service, Appearance and personal Hygiene of employees | ----------- |
| Convenience | .500 .000 | 63.203 | Location, Convenience | ------------ |
| Price | .500 .000 | 69.772 | Ease of Payment and Value | ------------ |
Source: Research data from SPSS
Table 2 Communalities and Factor Loading
| Dimension | Attributes | Initial | Extraction | Load |
|---|---|---|---|---|
| Organoleptic characteristics | Temperature | 1.000 | .556 | .656 |
| Smell | 1.000 | .371 | .601 | |
| Presentation | 1.000 | .594 | .622 | |
| Taste | 1.000 | .548 | .737 | |
| Food | Hygiene | 1.000 | .605 | -.497 |
| Variety | 1.000 | .690 | .649 | |
| Environment | Structure | 1.000 | .571 | .756 |
| Familiar Atmosphere | 1.000 | .666 | .816 | |
| Open Environment | 1.000 | .540 | .735 | |
| Security | 1.000 | .425 | .652 | |
| Service | Fast service | 1.000 | .593 | .770 |
| Good service | 1.000 | .652 | .808 | |
| Appearance and Hygiene of employees | 1.000 | .563 | .750 | |
| Convenience | Location | 1.000 | .632 | .795 |
| Convenience | 1.000 | .632 | .795 | |
| Price | Value | 1.000 | .698 | .835 |
| Ease of Payment | 1.000 | .698 | .835 |
Source: Research data from SPSS
Table 3 Reliability statistics
| Dimension | Food | Environment | Service | Convenience | Price | |
| Cronbach's Alpha | .676 | .721 | .660 | .417 | .554 |
Source: Research data from SPSS
Table 4 Results of the exploratory factor analysis
| Conceptual scale (before factor analysis) | Empirical evaluation of the scale (after factor analysis) | ||
| Component | Variable | Component | Variable |
| 1. Food | B1.Healthy food B2. Variety B3. Presentation B4. Taste B5. Smell B6. Temperature B7. Hygiene | 1.Organoleptic characteristics | B1.Healthy Food B2. Presentation B3. Taste B4. Smell B5. Temperature |
| 2.Food | B6. Variety B7. Hygiene | ||
| 2. Environment | B8. Physical Structure B9. Familiar Atmosphere B10. Open Environment B11. Security | 3.Environment | B8. Physical Structure B9. Familiar Atmosphere B10. Open Environment B11. Security |
| 3. Service | B12. Fast Service B13. Good Service B14. Appearance and personal Hygiene of employees | 4.Service | B12. Fast Service B13. Good Service B14. Appearance and personal Hygiene of employees |
| 4. Convenience | B15. Location B16. Convenience | 5.Convenience | B15. Location B16. Convenience |
| 5. Price | B17. Value B18. Ease of Payment | 6.Price | B17. Value B18. Ease of Payment |
Source: The authors
Analysis of the Quantitative Stage
Data collection was carried out through a questionnaire-type survey in the quantitative stage. After its implementation, the data were properly prepared and aligned in a format suitable for analysis, as indication of Malhotra (2006) and Hair et al., (2005). Following, we present the results.
Profile
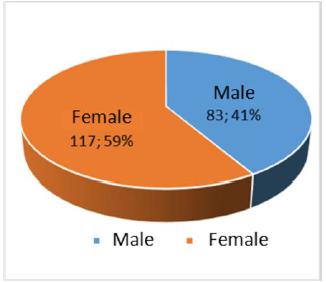
We sought to identify the clients who consume street food in Jardim da Penha Square. Specifically, information regarding gender, the frequency of purchase of street food in the square, age group, place of residence, and household income of the respondents.
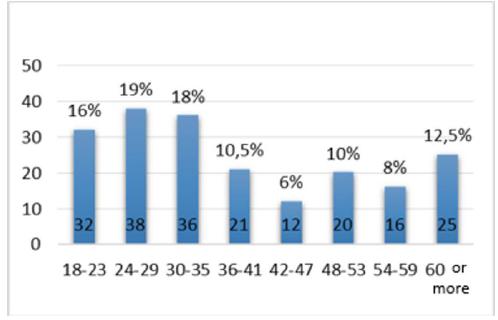
In relation to the gender, females were more represented (59 percent) in the samples, as shown in Figure 1. As for the variable age group, respondents between 24 and 29 years are the largest group (19 percent), as depicted in Figure 2. According to the data it is possible to realize that young people and adults up to 35 years of age are those with the highest representation in food consumption, in Jardim da Penha Square.
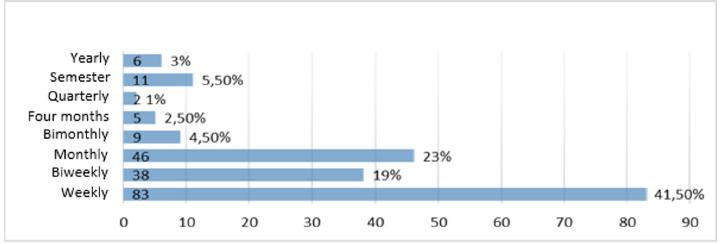
When asked about the frequency of purchase of street food in the square, a large number of respondents claimed to consume it every week (41.5 percent). Thus, from these results we can say that the majority of respondents have the habit of regularly buying street food in the square, as depicted in Figure 3.
To identify the social class of respondents, we asked about the household income, i.e. the combine incomes of all people living at home. The income ranges used in this work were based on the criteria of economic classification of ABEP (Brazilian Marketing Research Association), in which the strata of Brazil Criteria represent the average monthly income for the economic strata. This stratifycation is not based on the value of the current minimum wage. As of January 2015, income strata adopted are described in Figure 4. It is important to note that, in order to facilitate the application of the questionnaire and simplify the reading of the numbers, the digits that represent the cents have been rounded up.
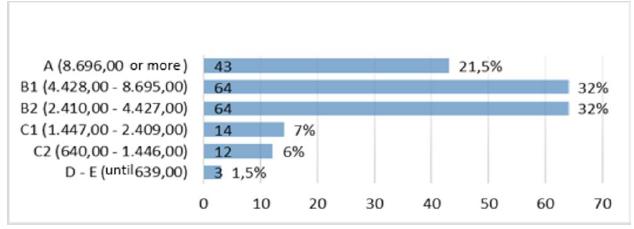
By analyzing Figure 4, it can be noticed that most of the people who participated in this study belong to the economic groups B1 (32 percent) and B2 (32 percent). Thus, we can affirm that consumers of Jardim da Penha Square are mostly people from middle and upper middle classes. This result does not support FAO's report (2011), which states that most people who consume street food have low purchasing power.
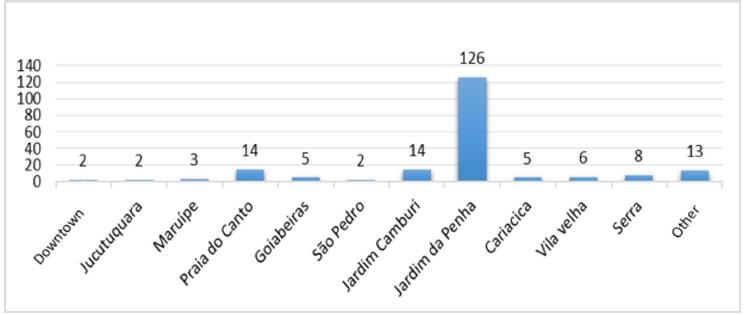
In relation to the place of residence, 126 people (63 percent) stated that they live in the region of the Jardim da Penha, as shown in Figure 5. This figure clearly indicates that the square is frequented mostly by people from the neighborhood.
Importance of the Attributes in the Purchase Decision
In the second part of the questionnaire, customers were questioned on the importance of attributes in the purchase decision when buying street food, since that in the process leading up to the purchase, as expressed by Blackwell, Miniard and Engel (2005), consumers evaluate the different possibilities available to make their purchasing decision, in order to best satisfy their demands.
However, because this is an exploratory study, we developed a scale to measure the importance of these attributes, which made necessary the use of exploratory factor analysis (EFA). According to Brown (2006) EFA is generally conducted when the researcher does not have an underlying theory or sufficient empirical evidence which clearly indicates how items of a given instrument must be grouped and evaluated.
Exploratory Factor Analysis (EFA) of the Importance of the Attributes
Considering that the attributes identified in the qualitative stage formed an 18-items scale, it was relevant to verify the distribution of these data. To this end, we used the statistical procedure of exploratory factor analysis (EFA). Factor analysis helps in the evidences relating to the validity of questionnaires, commonly used in research (Hair et al., 2005).
The EFA was held separately in each of the dimensions (categories) in order to assist in the evaluation of the distribution of attributes in the dimensions, thus the distribution and organization of the scale reflected the theory of core attributes and EFA.
The analytical technique employed was the exploratory perspective as it is "[...] useful in searching for structure among a set of variables or as a data reduction method [...]" (Hair et al., 2005, p. 92). Normally the exploratory factor analysis (EFA) is used in initial research with the purpose of exploring the data.
For the development of this analysis we used oblique rotation, identifying the correlation degree of each factor (Hair et al., 2005). Factor rotation was performed aiming factor adjustment in search of simple and more significant solutions, to improve the interpretation and reduce the ambiguity (Hair et al., 2005). The factor analysis was performed using SPSS Software. Next we present the criteria and results of the EFA.
Exploratory Factor Analysis Results
The KMO and Bartlett tests were carried out initially. These tests verify if the factor analysis is appropriate. The test of Kaiser-Meyer-Olklin (KMO) varies between 0 and 1. The closer to 1 the better, with acceptable values between 0.5 and 1 (Hair et al., 2005). Values below 0.5 indicate inadequacy (Hair et al., 2005). For Bartlett's test of sphericity (BTS) the acceptable values are less than 0.05 (p < 0.05). As depicted in Table 1, all values are within the limits indicated.
The number of factors to be extracted was determined by the latent root criterion, in which the eigenvalues greater than 1 should be retained, always trying to reach the recommended minimum of 60 percent of accumulated variance, indicated by Hair et al. (2005). To perform this procedure, the attributes of the dimension "food" were distributed in three components to a higher cumulative variance. However the variable "healthy food" would form a single construct.
This gave rise to a theoretical reflection on this variable. Despite the studies by Liu and Jang (2009); Harrington, Ottenbacher and Way (2011) and Castelo Branco (2000) that highlighted only the variable healthy food, other authors such as Steptoe, Pollard and Wardle (1995) and Yuksel and Yukesel (2002) provide evidence that the variable "healthy food" can be composed of other factors, considering, for example, the caloric content of food and the amount of vitamins, nutrients, proteins and fat. Thus, it appears that this variable is not complete in the way it was measured, so we decided to remove this variable. Two components were then formed and renamed as shown in Table 1.
After the EFA, the remaining dimensions remained with the same structure of the scale originally used, as depicted in Table 2.
The communalities represent the total amount of variance that an original variable shares with all other included in the analysis. Hair et al. (2005) suggest that the acceptable levels of communality must be greater than or equal to 0.5. Values below that should be evaluated and it is up to the researcher the decision to keep the variable or not (Hair et al., 2005). You can verify that the variable "smell" and "safety" present a communality value below the critical level (0.371), however we decided to keep this variable given the theoretical support.
The values of factor loadings of the components are shown in Table 2. Hair et al. (2005) explain that factor loading is the correlation between the variable and the factor. It represents the acceptable limit of contribution of the variable to the factor in order to avoid the problem of the indeterminacy of the relationship between variables and factors. For statistical significance of a sample of 200, as in the case of this study, the loads must be equal or greater than 0.4 (Hair et al., 2005).
Reliability was tested with Cronbach's Alpha coefficient, which constitutes one of the most widely adopted procedures to assess the reliability of a scale (Malhotra, 2001). According to Hair et al. (2005), the acceptable values of Cronbach's alpha should vary between 0.6 and 0.9.
The value of Cronbach's alpha is influenced both by the value of the correlations of the items, and the number of items. Thus, factors with few items tend to have smaller Cronbach's alpha (Cortina, 1993). The constructs "convenience" and "price" have Cronbach's alpha values (see Table 3) below the acceptable values indicated by the literature.
From the development of exploratory factor analysis, it was possible to infer some modifications in relation to the attributes and constructs initially used in this research, so that the original scale suffered adjustments for better reliability and validity to the questionnaire, as noted in Table 4.
Factor analysis led to changes in the scale shown in Table 5. This new structure was considered for the analysis of the importance of attributes presented in the next topic.
Analysis of the importance of the attributes
The guiding hypothesis of this study is based on the theory of Alpert (1971), which notes that the attributes can have different degrees of importance. To answer the problem of this research, the hypothesis was based on identifying whether there is a difference in degree of importance assigned by the customers to the attributes.
Therefore, we developed hypotheses to test the similarities and differences between the averages, in order to prove or disprove the theory of Alpert (1971). The first hypothesis is as follows:
Ha: There is no difference in the degree of importance assigned by customers, to attributes.
This test considered a confidence interval of 95 percent, with the significance level (α) of 0.05. According to Levine et al. (2012), if the p-value falls below the predetermined significance level (α = 0.05) H0 is not confirmed, which shows that at least one of the averages is different from the other. When the p-value is above the previously established significance level (α = 0.05) H0 is not rejected.
To test the hypothesis (Ha), we used Excel tool and conducted the tests for the analysis of variance (ANOVA). The variance measures how much is the mean variation around the arithmetic mean of attributes, in order to check if there are statistical difference between these averages (Levine et al., 2012). The results are presented in Table 1.
The analysis the p-value (4.609E-11) showed that it is less than 0.05. In common numbers that scientific notation is equivalent to approximately 0 (zero). This indicates that H0 is rejected, i.e. at least one of the means is different from the others. This information assumes that at least one of the constructs exerts different influence from the others on the buying decision, then there are different degrees of importance, assigned by the customers to the constructs. In this way, the theory of Alpert (1971) is verified as to the existence of differences in the degree of importance assigned by customers to the attributes.
Classification of the Attributes
It is also necessary to know which constructs have different means and put them in descending order of importance for, if possible, sort them in determinant, important and salient. Only constructs that presented statistically equal averages were classified in the same way.
In order to identify which construct features distinct mean from the others, we conducted new tests of hypotheses involving two constructs to each test. For this new test of hypotheses we used t test for the difference between two means assuming different variances. This method is used to evaluate the statistical differences between two arithmetic means (Levine et al., 2012). The test was performed with Excel tool. The hypotheses for this test are presented in Table 6, as well as the p-value obtained in each one of these tests and the hypotheses results.
Table 5 ANOVA of importance
| Variation source | SQ | Gl | MQ | F | P- Value | Critical F |
|---|---|---|---|---|---|---|
| Between groups | 36.5716666 | 5 | 7.314333333 | 11.7025 | 4.609E-11 | 2.22159 |
| Inside groups | 746.2775 | 1194 | 0.625023032 | |||
| Total | 782.849166 | 1199 |
Source: Research data
Table 6 Tested Hypotheses
| Hypothesis: H0 (µ1= µ2) | P-Value | Situation |
|---|---|---|
| Haa: There is not a difference of the level of the importance, assigned by customers, between the constructs organoleptic characteristics and food. | 0.87149 | H0 not rejected, means are not different |
| Hab: There is not a difference of the level of the importance, assigned by customers, between the constructs organoleptic characteristics and environment. | 0.05205 | H0 not rejected, means are not different |
| Hac: There is not a difference of the level of the importance, assigned by customers, between the constructs organoleptic characteristics and service. | 0.01180 | H0 not confirmed, means are different |
| Had: There is not a difference of the level of the importance, assigned by customers, between the constructs organoleptic characteristics and convenience. | 0.00106 | H0 not confirmed, means are different |
| Hae: There is not a difference of the level of the importance, assigned by customers, between the constructs organoleptic characteristics and price. | 1.28E-05 | H0 not confirmed, means are different |
| Haf: There is not a difference of the level of the importance, assigned by customers, between the constructs food and environment. | 0.08847 | H0 not rejected, Means are not different |
| Hag: There is not a difference of the level of the importance, assigned by customers, between the constructs food and service. | 0.01094 | H0 not confirmed, means are different |
| Hah: There is not a difference of the level of the importance, assigned by customers, between the constructs food and convenience. | 0.00230 | H0 not confirmed, means are different |
| Hai: There is not a difference of the level of the importance, assigned by customers, between the constructs food and price. | 4.14E-05 | H0 not confirmed, means are different |
| Haj: There is not a difference of the level of the importance, assigned by customers, between the constructs environment and service. | 7.35E-05 | H0 not confirmed, means are different |
| Hak: There is not a difference of the level of the importance, assigned by customers, between the constructs environment and convenience. | 0.10985 | H0 not rejected, means are not different |
| Hal: There is not a difference of the level of the importance, assigned by customers, between the constructs environment and price. | 0.0092 | H0 not confirmed, means are different |
| Ham: There is not a difference of the level of the importance, assigned by customers, between the constructs service and convenience. | 1.05E-06 | H0 not confirmed, means are different |
| Han: There is not a difference of the level of the importance, assigned by customers, between the constructs service and price. | 4.45E-09 | H0 not confirmed, means are different |
| Hao: There is not a difference of the level of the importance, assigned by customers, between the constructs convenience and price. | 0.39113 | H0 not rejected, means are not different |
Source: The authors
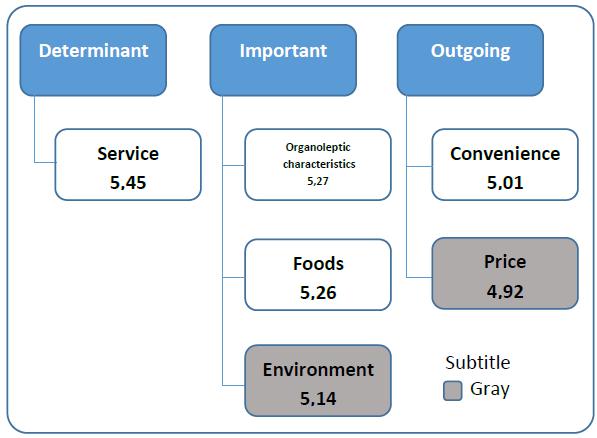
To classify the degree of importance, those constructs with averages no different between themselves were considered within the same classification. Thus, following the hierarchy, for purposes of classification, the construct "convenience" was considered along with "price", but separated from "environment", because "price" and "environment" did not presented equal means (see Table 6), which demonstrates the existence of a gray area, depicted in Figure 6. This shows that there may be other possible forms of classifications. This work followed the theory of Alpert (1971), thus the classification was limited to a maximum of three alternatives, regarding the importance of the constructs. It was obtained the classification shown in Figure 6.
Source: The authors
Figure 6 Classification of the importance of the constructs, with the gray area highlighted
Responding to the research problem, it can be observed that the determinant construct is service. This construct is formed by the attributes: fast service, good service, appearance and personal hygiene of employees. The important constructs are: organoleptic characteristics, formed by: presentation, taste, smell, temperature. Food, is formed by variety and hygiene. And environment comprised of: physical structure, familiar atmosphere, open environment and security. The salient constructs are convenience, consisting of: convenience and location, and price, formed by value and ease of payment.
These results will meet those revealed by Mhlanga, Hattingh and Moolman (2014), in which these authors showed that the level of service is the main factor considered by customers in the context of restaurants. According to the same study, the organoleptic characteristics are essential to provide good food and they were also highlighted as important and come right after service.
Regarding services, Sanches and Salay (2011) reveal that the personal hygiene of the employees is the most important factor when it comes to choosing a restaurant to have meals away from home.
The study of Namkung and Jang (2007) showed that the presentation, taste and temperature (organoleptic characteristics) were the most significant for customer satisfaction in restaurants. Similarly Liu and Jang (2009) revealed that the taste of food is essential to influence purchase decisions. The service offered appears next. In the study of Park (2004) the taste of food was also considered the most important, followed by hygiene and service.
Soriano (2002) obtained similar results, in which the variety and presentation of the food were the most important influence on customers' decisions to return to a restaurant for another meal. The service was the second most important factor.
Yuksel and Yuksel (2002) revealed that, although important, the environment appears as the last relevant factor influencing the selection and evaluation of restaurants. Similarly, Soriano (2002) obtained that environment was the least important factor considered in the influence of customers' decisions to return to a restaurant.
Harrington, Ottenbacher and Way (2011) showed that price and distance (location), although important, are not among the first factors in the ranking of importance. The results of Park (2004) and Sanches and Salay (2011) also highlight this fact.
The factor that stands out for being classified in different ways is price. In some studies, like Abdullah, Abdurahman and Hamali (2013), and Ehsan's (2012), the price was regarded as the most important dimension of customer preference in the food sector to select restaurants. In the studies of Siebeneichle et al. (2007) and Souki (2010), the price and ease of payment appear as the last factor in the order of importance. Thus, although important in the decision to purchase, there are other factors, such as high performance, that make the consumer less sensitive to price.
The results of this study identified that price is an important variable for the purchasing decision, however it is not the most important. Thus, consistent with the results of Pelissari et al. (2011), in which the authors claim that, although the price is an influential variable in purchasing decisions, it is not necessarily determinant for customers. However, it is important to highlight that price acts directly as a factor of competitiveness. Similarly, Reis (2004) posits that in face of a market in which products and services are becoming more alike, customers give importance to other factors besides price.
This study confirms the theory of Griffin (1998), in which he states that consumers are becoming more interested in customer service when buying something, representing the service factor in this study. Thus, the importance of service surpasses price and product factors (Griffin, 1998).
FINAL CONSIDERATIONS
The objective of this study was to examine a field still little explored, seeking to understand and deepen existing gaps regarding the consumption of street food. The general objective of this research focused on identifying which attributes are determinant for consumers' buying decisions in establishments that sell street food, from data collection and analysis in a street market in a square located in the city of Vitória/ES.
The categories used were: food, environment, service, convenience, and price. Thus, there is a contribution of this work to the creation of a scale for the development of research on the street food sector, with regard to the measurement of importance and satisfaction of attributes and constructs.
From data obtained in the quantitati-ve stage, it was possible to identify the profile of street food consumers. Most consumers are women (59 percent). The predominant frequency of purchase is weekly (41.5 percent) or monthly (23 percent), which indicates regularity of street food consumption. The age groups that stand out are: 24 to 29 years (19 percent) and 30 to 35 years (18 percent), followed by the seniors, 60 years or more, representing (12.5 percent). Thus, highlighting the attendance at these places of young people, between 24 to 35 years, which represent the largest number of people eating weekly in the square. This is an audience which most represents the economic strata A and B. Most of those going to the street market, 63 percent, live in Jardim da Penha neighborhood.
These results reflect the profile of the population of this neighborhood. It is a young population in a neighborhood located in front of the campus of the Federal University of Espírito Santo (UFES) with brings many young students to this area.
It was possible to test and confirm the hypothesis based on the theory of Alpert (1971), which stated: there is a difference in the degree of importance, assigned by customers, to attributes. The tests conducted allowed to confirm the hypothesis, thus responding to the research problem. It can be affirmed that there are attributes that influence more than others the buying decision and it is possible to sort these attributes as to their degree of importance. "Service" has been identified as the determinant construct. Its attributes are: fast service, good service, appearance and personal hygiene of employees. These are the aspects to which managers must pay attention in order to continuous improvement.
To complement, given the other objectives of the research, we have as important constructs: "organoleptic characteristics", with the attributes: presentation, taste, smell and temperature; "food", formed by variety and hygiene; and "environment", formed by physical structure, familiar atmosphere, open environment, and security. The salient constructs are "convenience", composed of location and convenience; and "price", formed by value and ease of payment.
Therefore, the top-ranked attribute identified is "service", with a degree of importance of 5.45 (on a scale of 6). It follows "organoleptic characteristics" (5.27), "food" (5.26), "environment" (5.14), convenience (5.01), and "price" (4.92).
It is concluded that the attention of the managers of such enterprises must address service-related attributes. Muller and Woods (1994) claim that managers must spend considerable resources in the attributes identified as those that will satisfy the largest number of potential customers.
These results refer exclusively to the object of study and do not represent the reality of all Brazilian street markets, which is acknowledged as a limitation of this study. It is suggested that further research should be undertaken in other street food markets in order to fill theoretical gaps on the subject, as well as to compare results in order to identify possible generalizations.

